The Metallurgy of Clad Metals: Bond Formation Mechanisms
1. Introduction
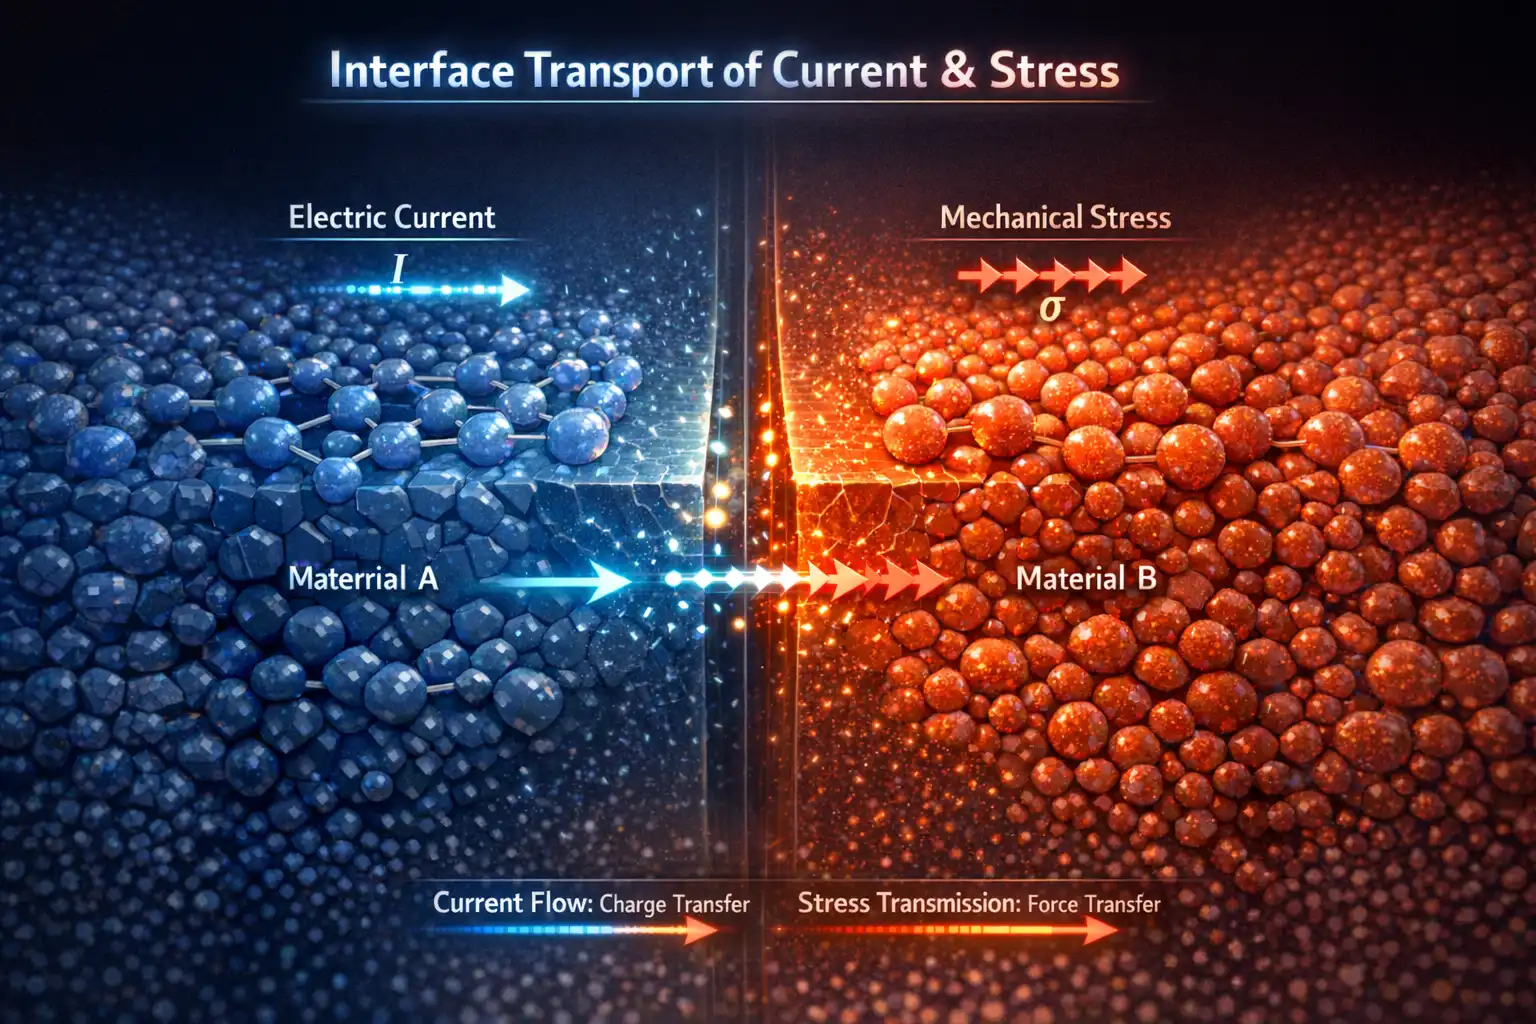
In bimetallic conductors, the interface between constituent metals is both the greatest challenge and the most critical factor determining product performance. High-quality bonding enables:
- Efficient interlayer load transfer
- Uniform current distribution across cross-section
- Thermal stability during operation
- Long-term reliability in service
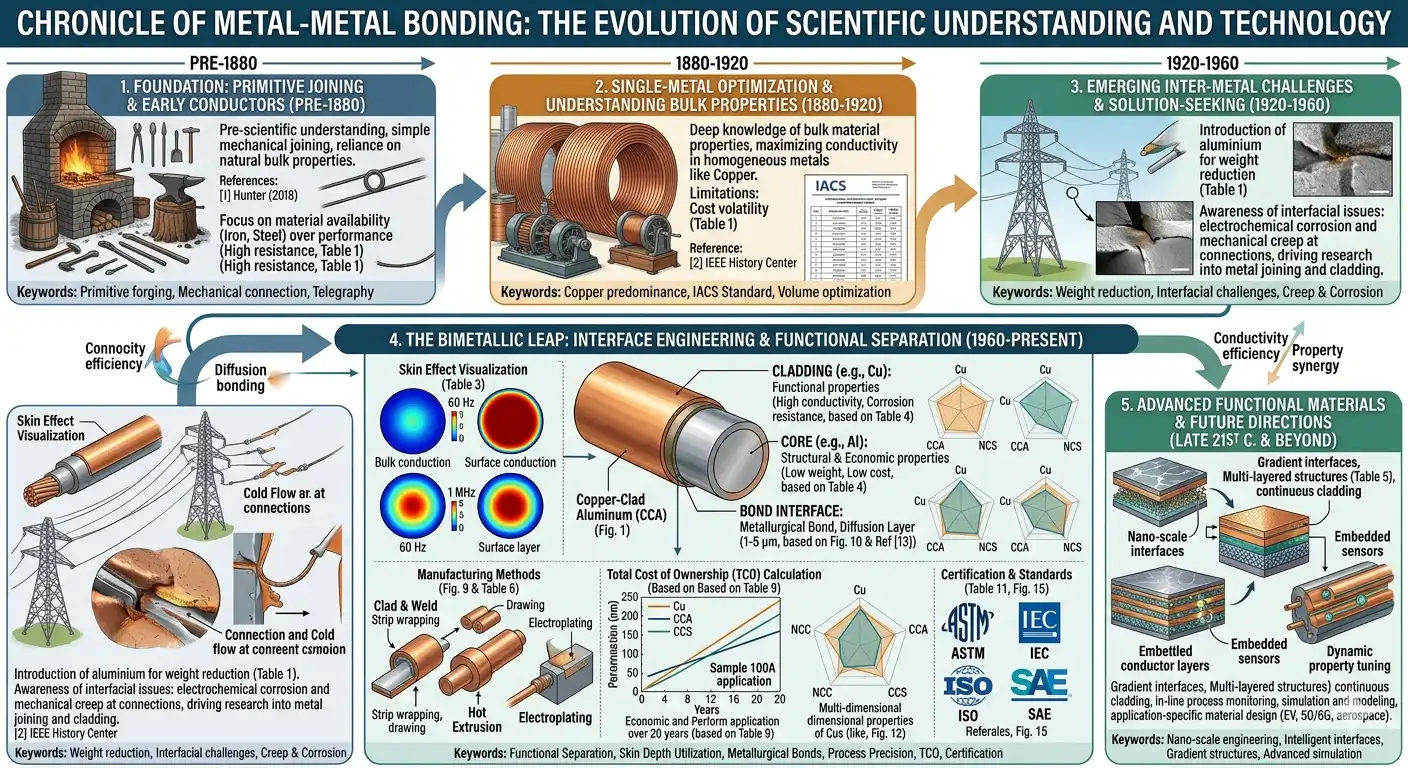
Understanding of metal-metal bonding has significantly evolved:
2. Bond Formation Mechanisms
Three primary mechanisms contribute to bond formation in clad metals:
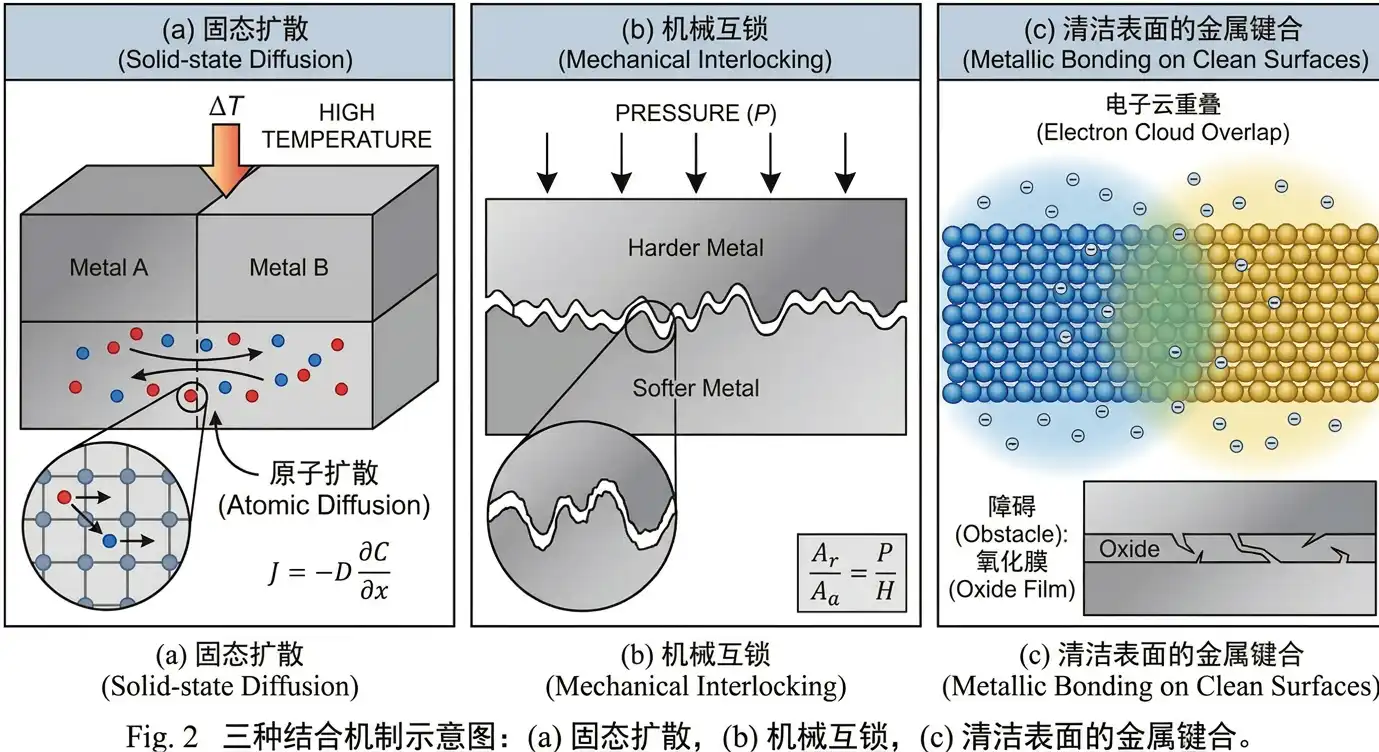
- Solid-state diffusion
- Mechanical interlocking
- Clean-surface metallic bonding
The relative contribution of each mechanism depends on material combination and processing conditions.
Thermodynamic Basis:
Where:
- J = Diffusion flux (atoms/m²·s)
- D = Diffusion coefficient (m²/s)
- ∂C/∂x = Concentration gradient
Temperature Dependence:
The diffusion coefficient follows the Arrhenius relationship:
Mechanism Description:
At the microscopic scale, even polished metal surfaces exhibit roughness. When two surfaces are pressed together and deformed, asperities interlock:
Key Factors:
- Surface roughness: Initial asperity height distribution
- Deformation pressure: Contact stress magnitude
- Material ductility: Ability to fill voids
- Temperature: Softening for better conformity
Quantitative Model:
The ratio of actual contact area Aᵣ to apparent area Aₐ:
Where P = applied pressure, H = hardness of the softer material.
Theoretical Basis:
When atomically clean metal surfaces contact, metallic bonds can form directly:
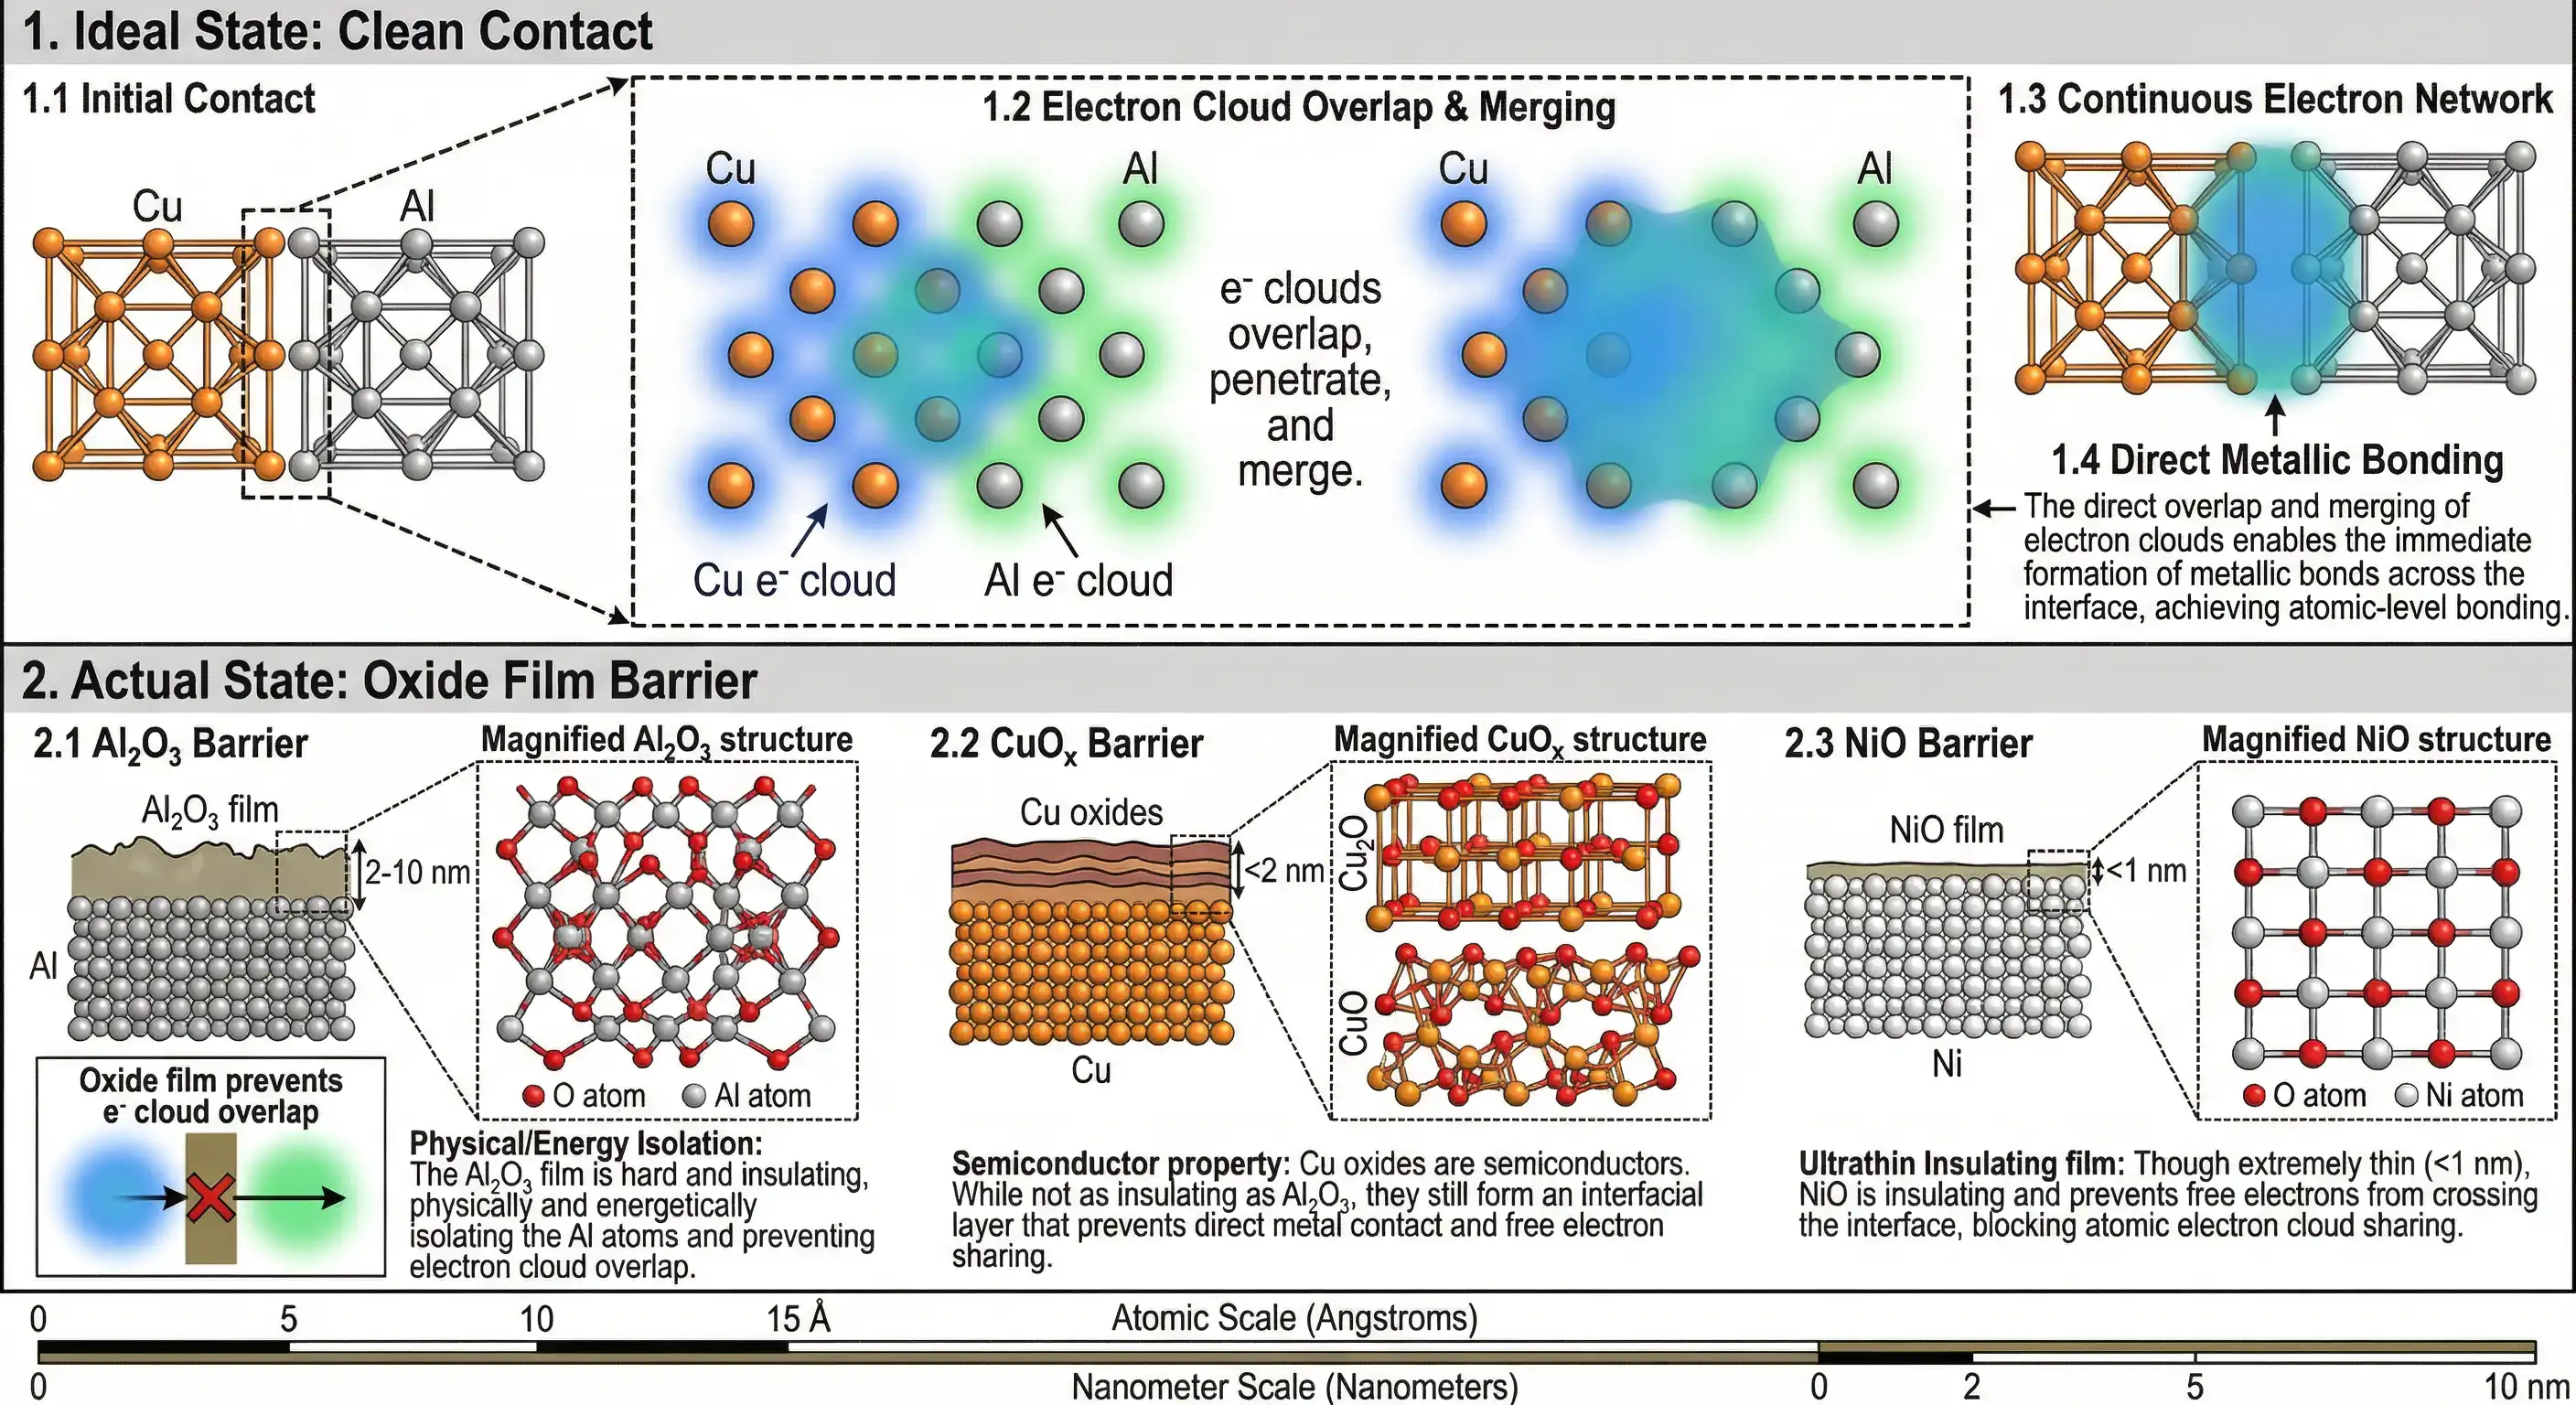
Barrier: Oxide Films
In practice, oxide films prevent direct metal contact:
- Aluminum oxide (Al₂O₃): 2-10 nm thick, hard, insulating
- Copper oxide (Cu₂O, CuO): <2 nm, semiconducting
- Nickel oxide (NiO): <1 nm, insulating
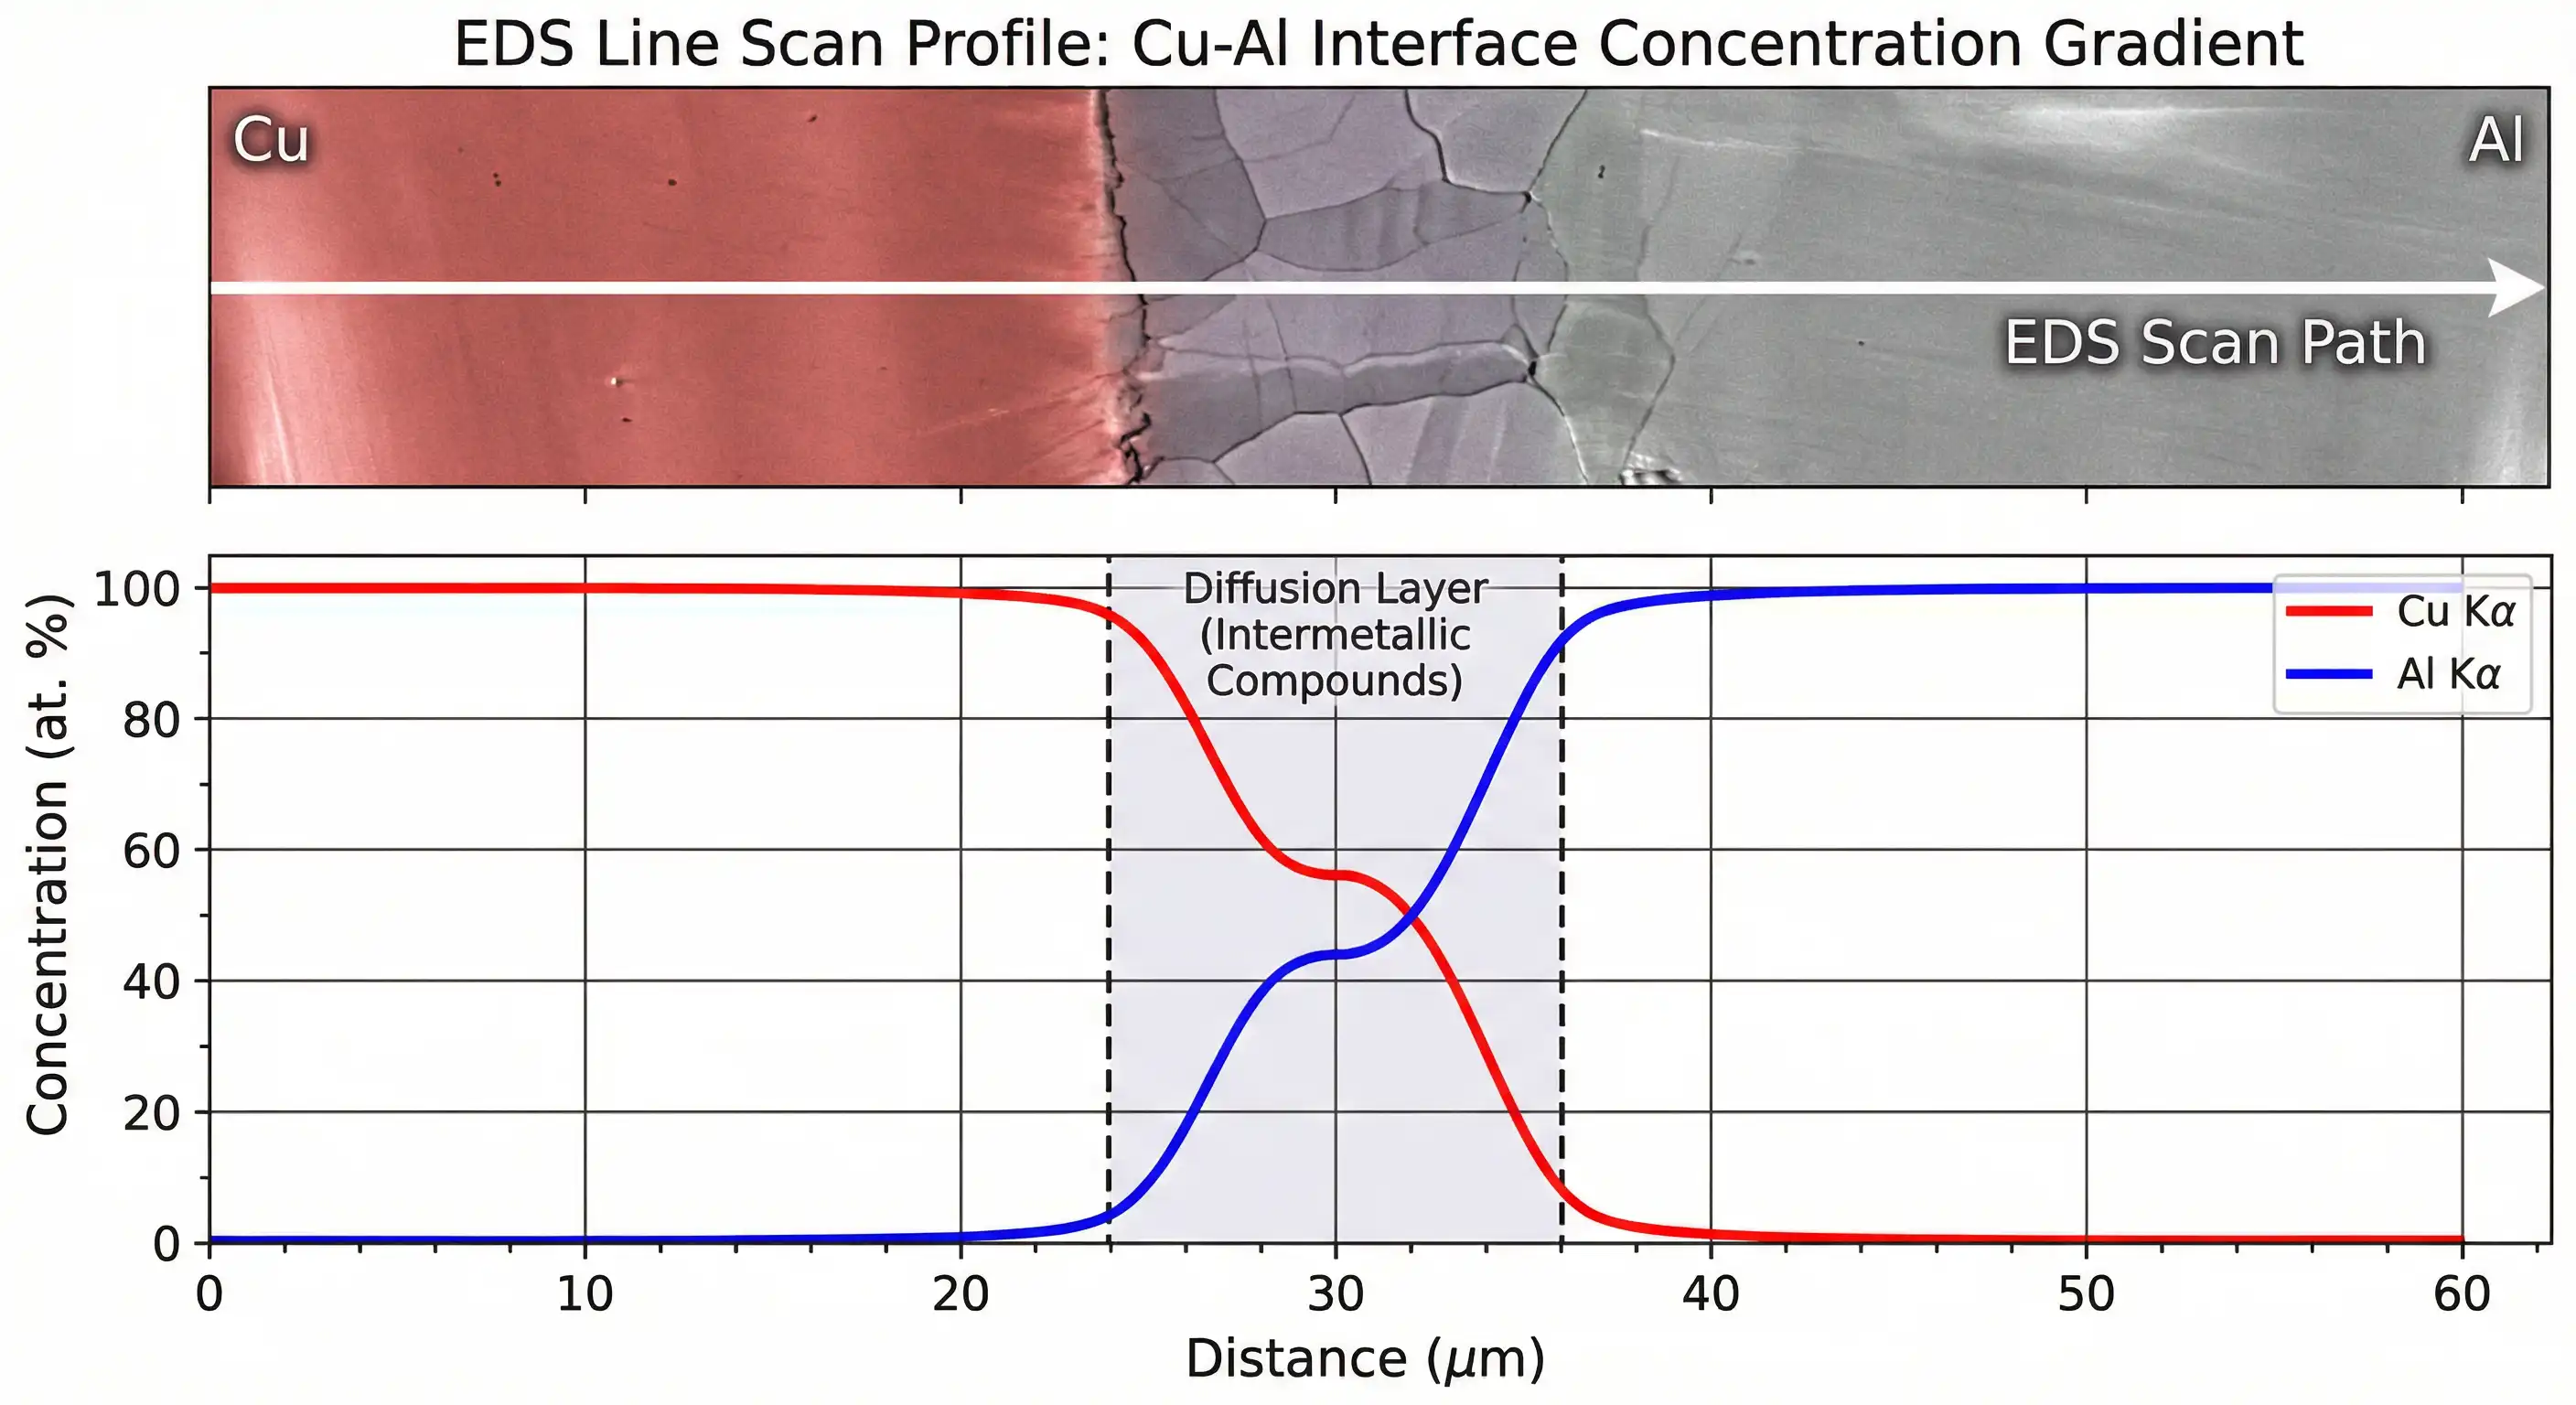
3. Interface Characterization
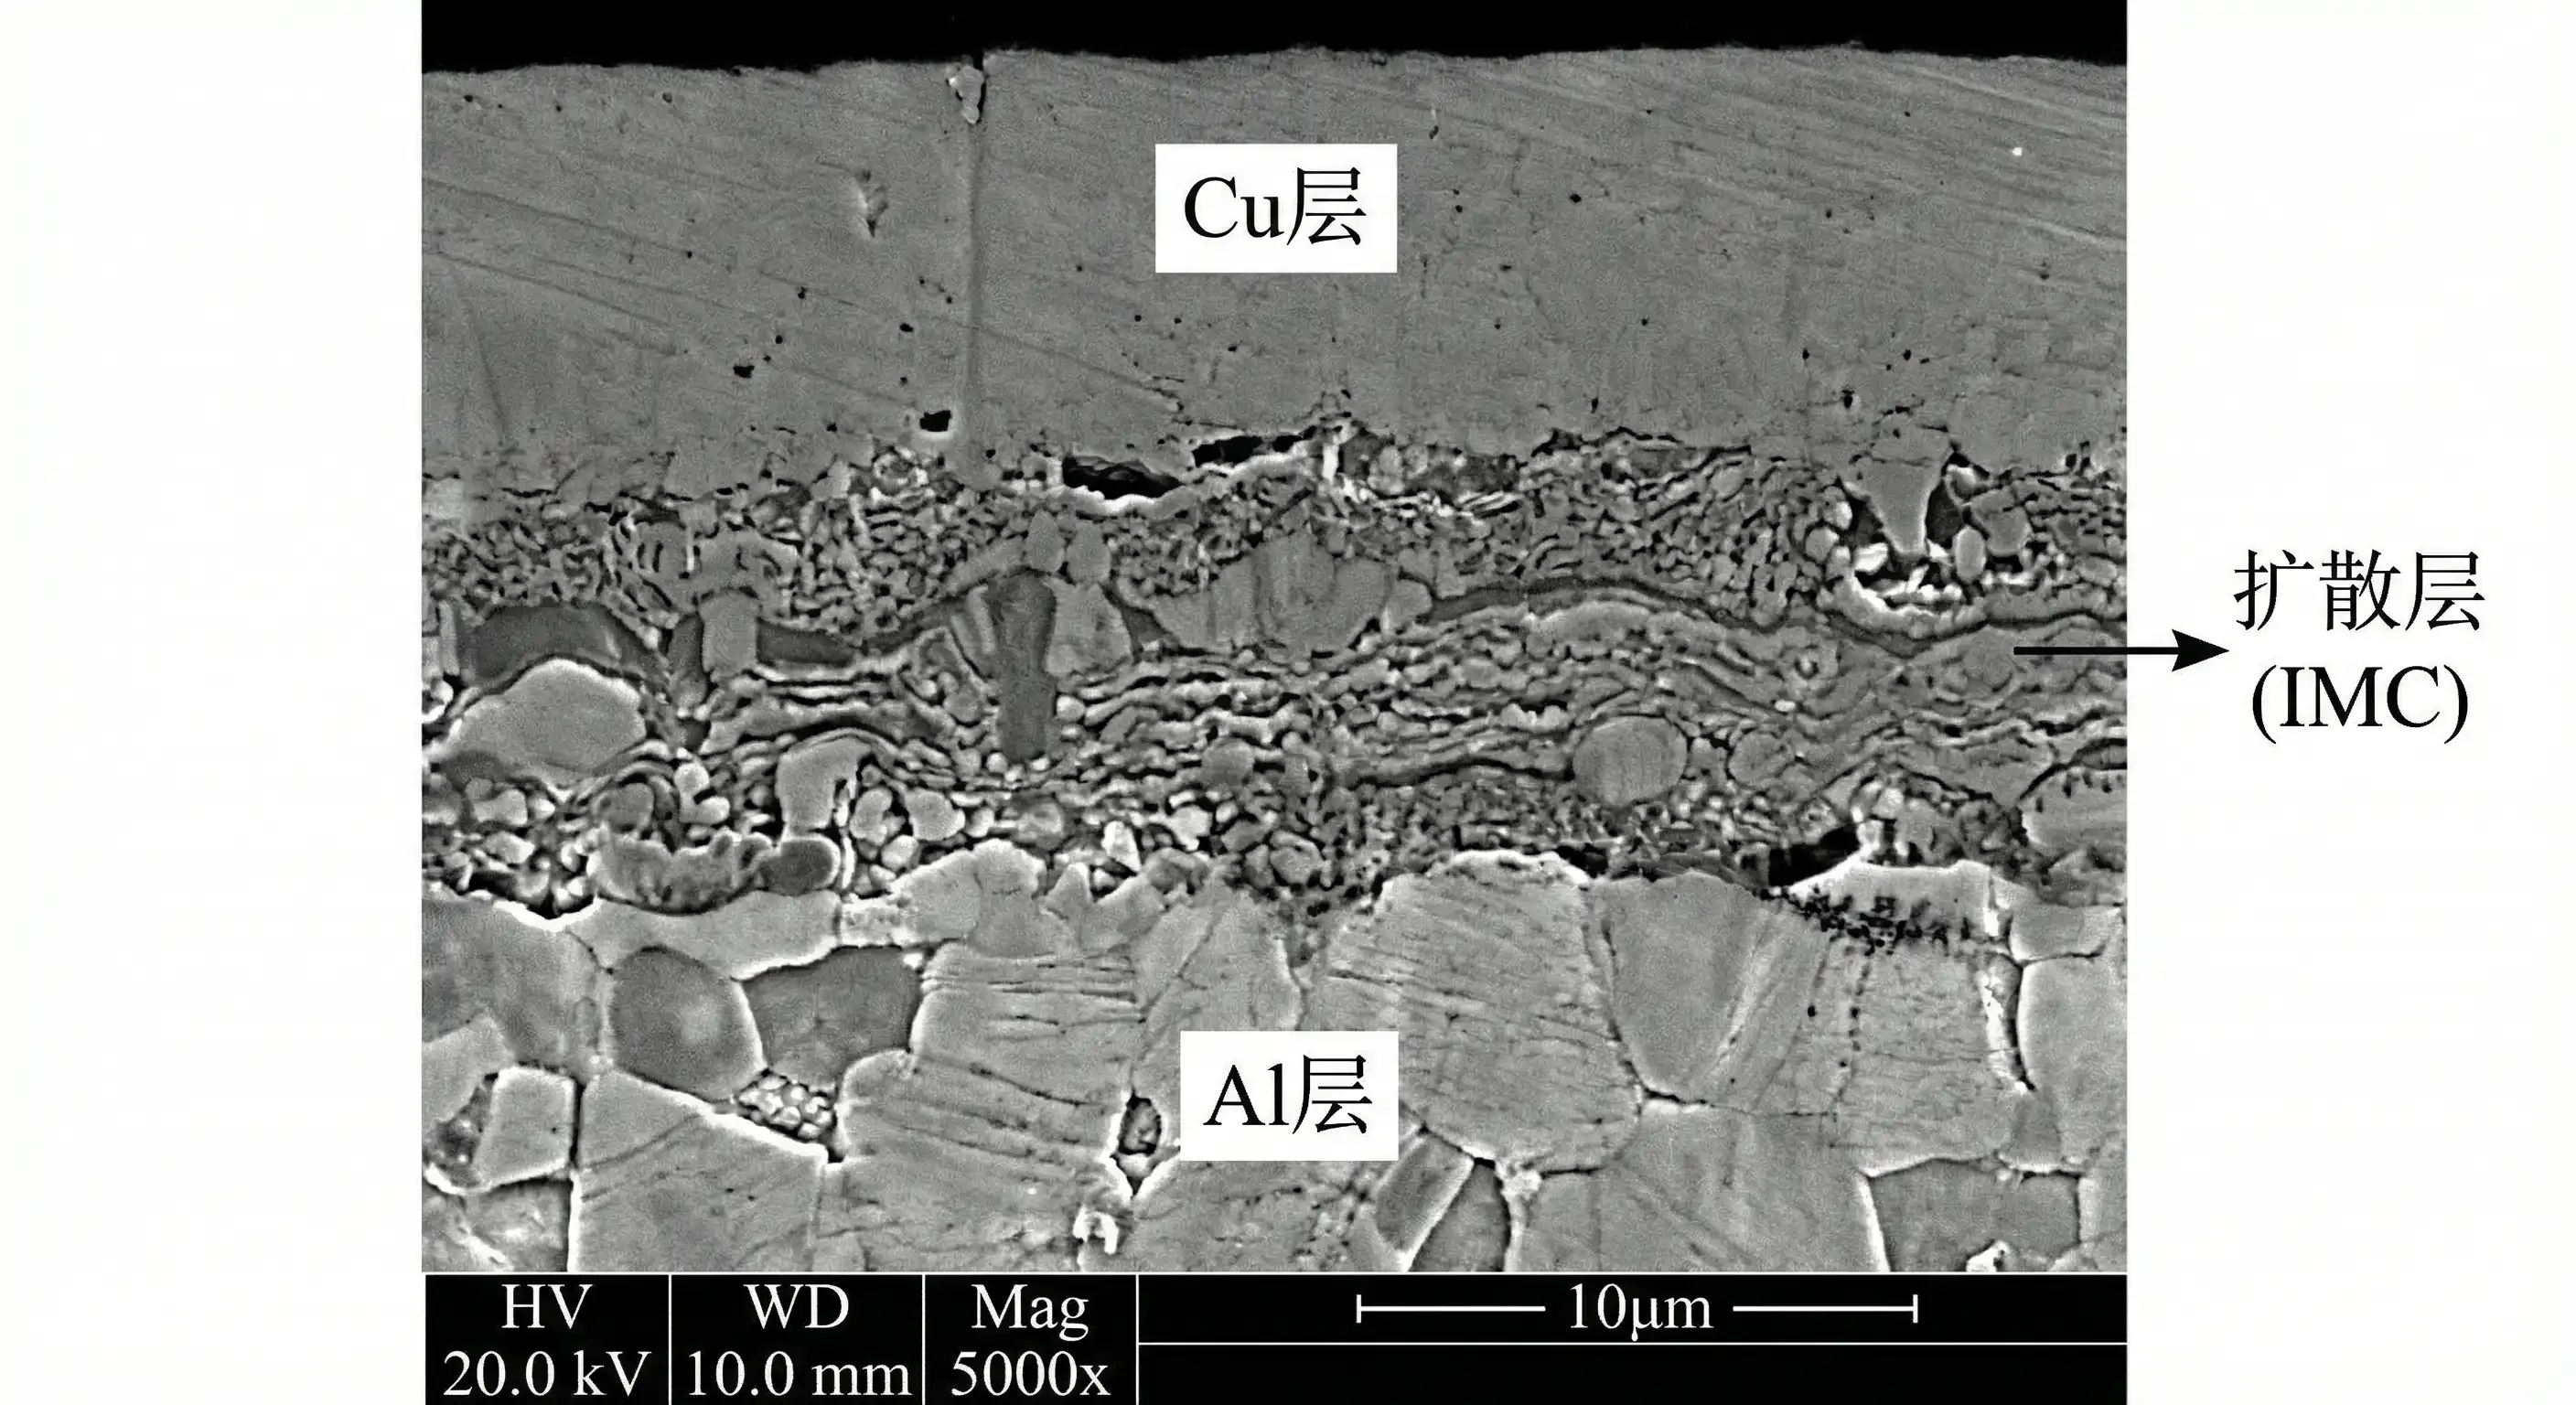
EDS (Energy Dispersive Spectroscopy):
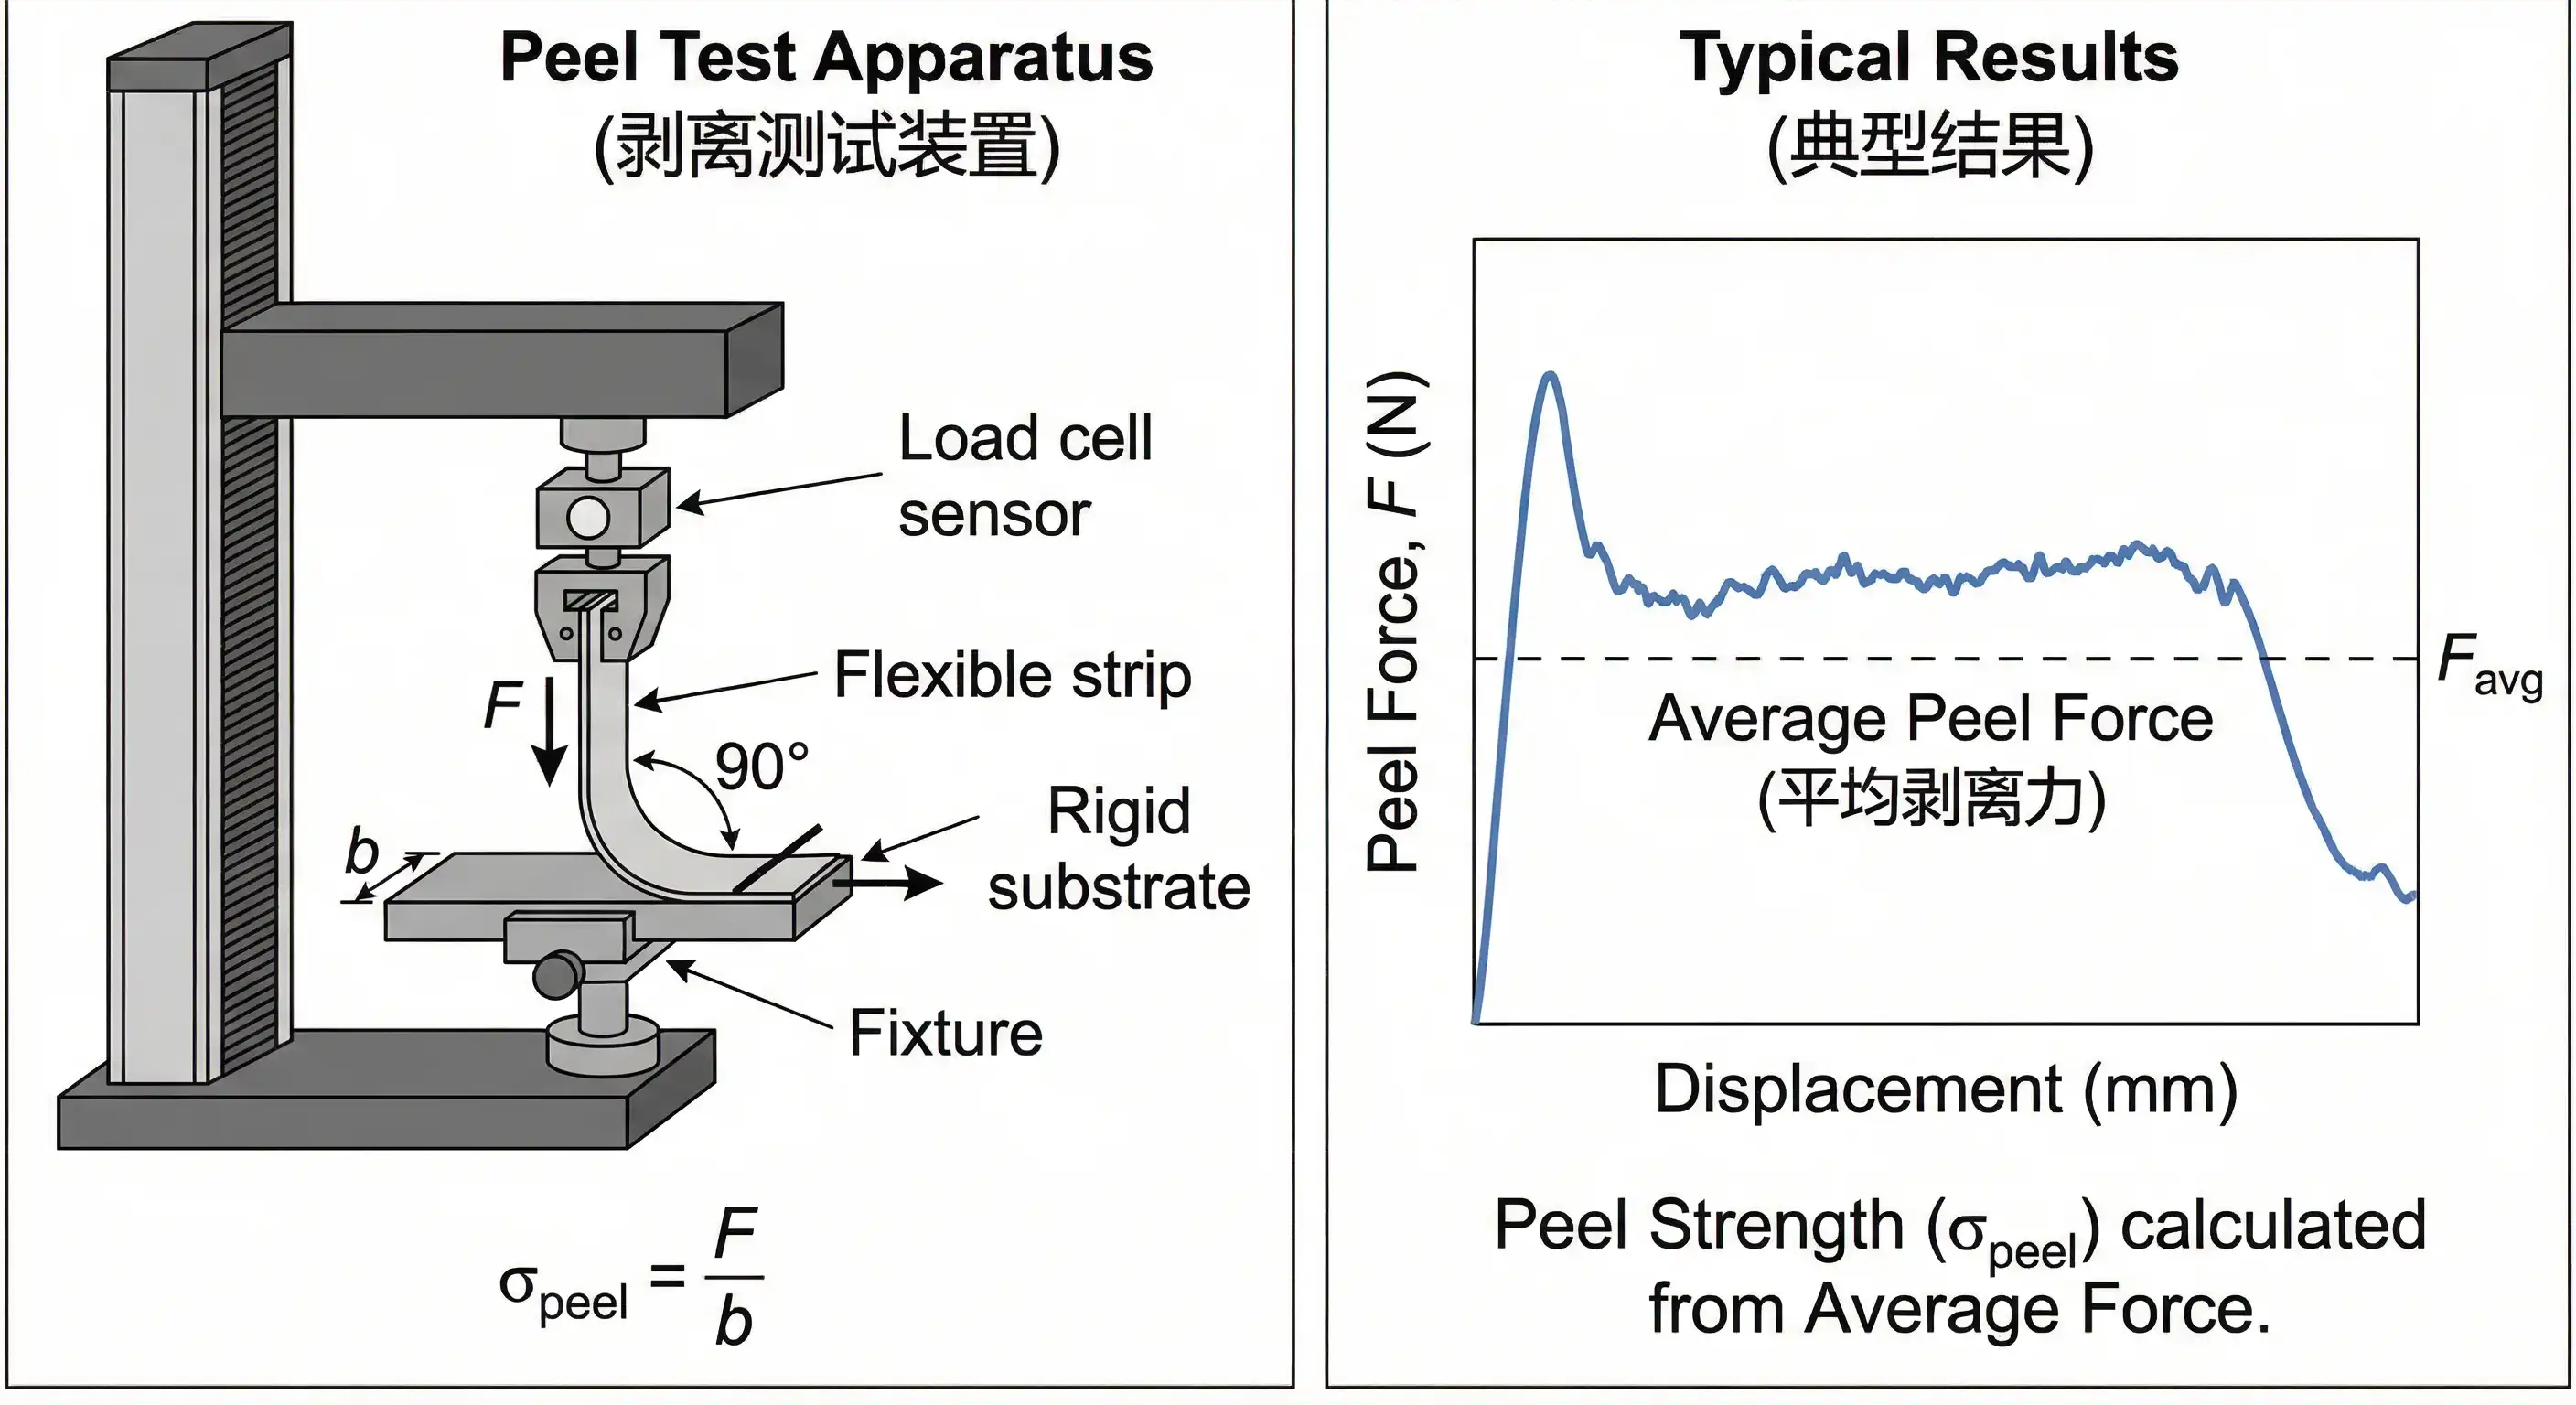
Peel Testing:
Standard method for quantifying bond strength:
Where F = peel force, b = specimen width.
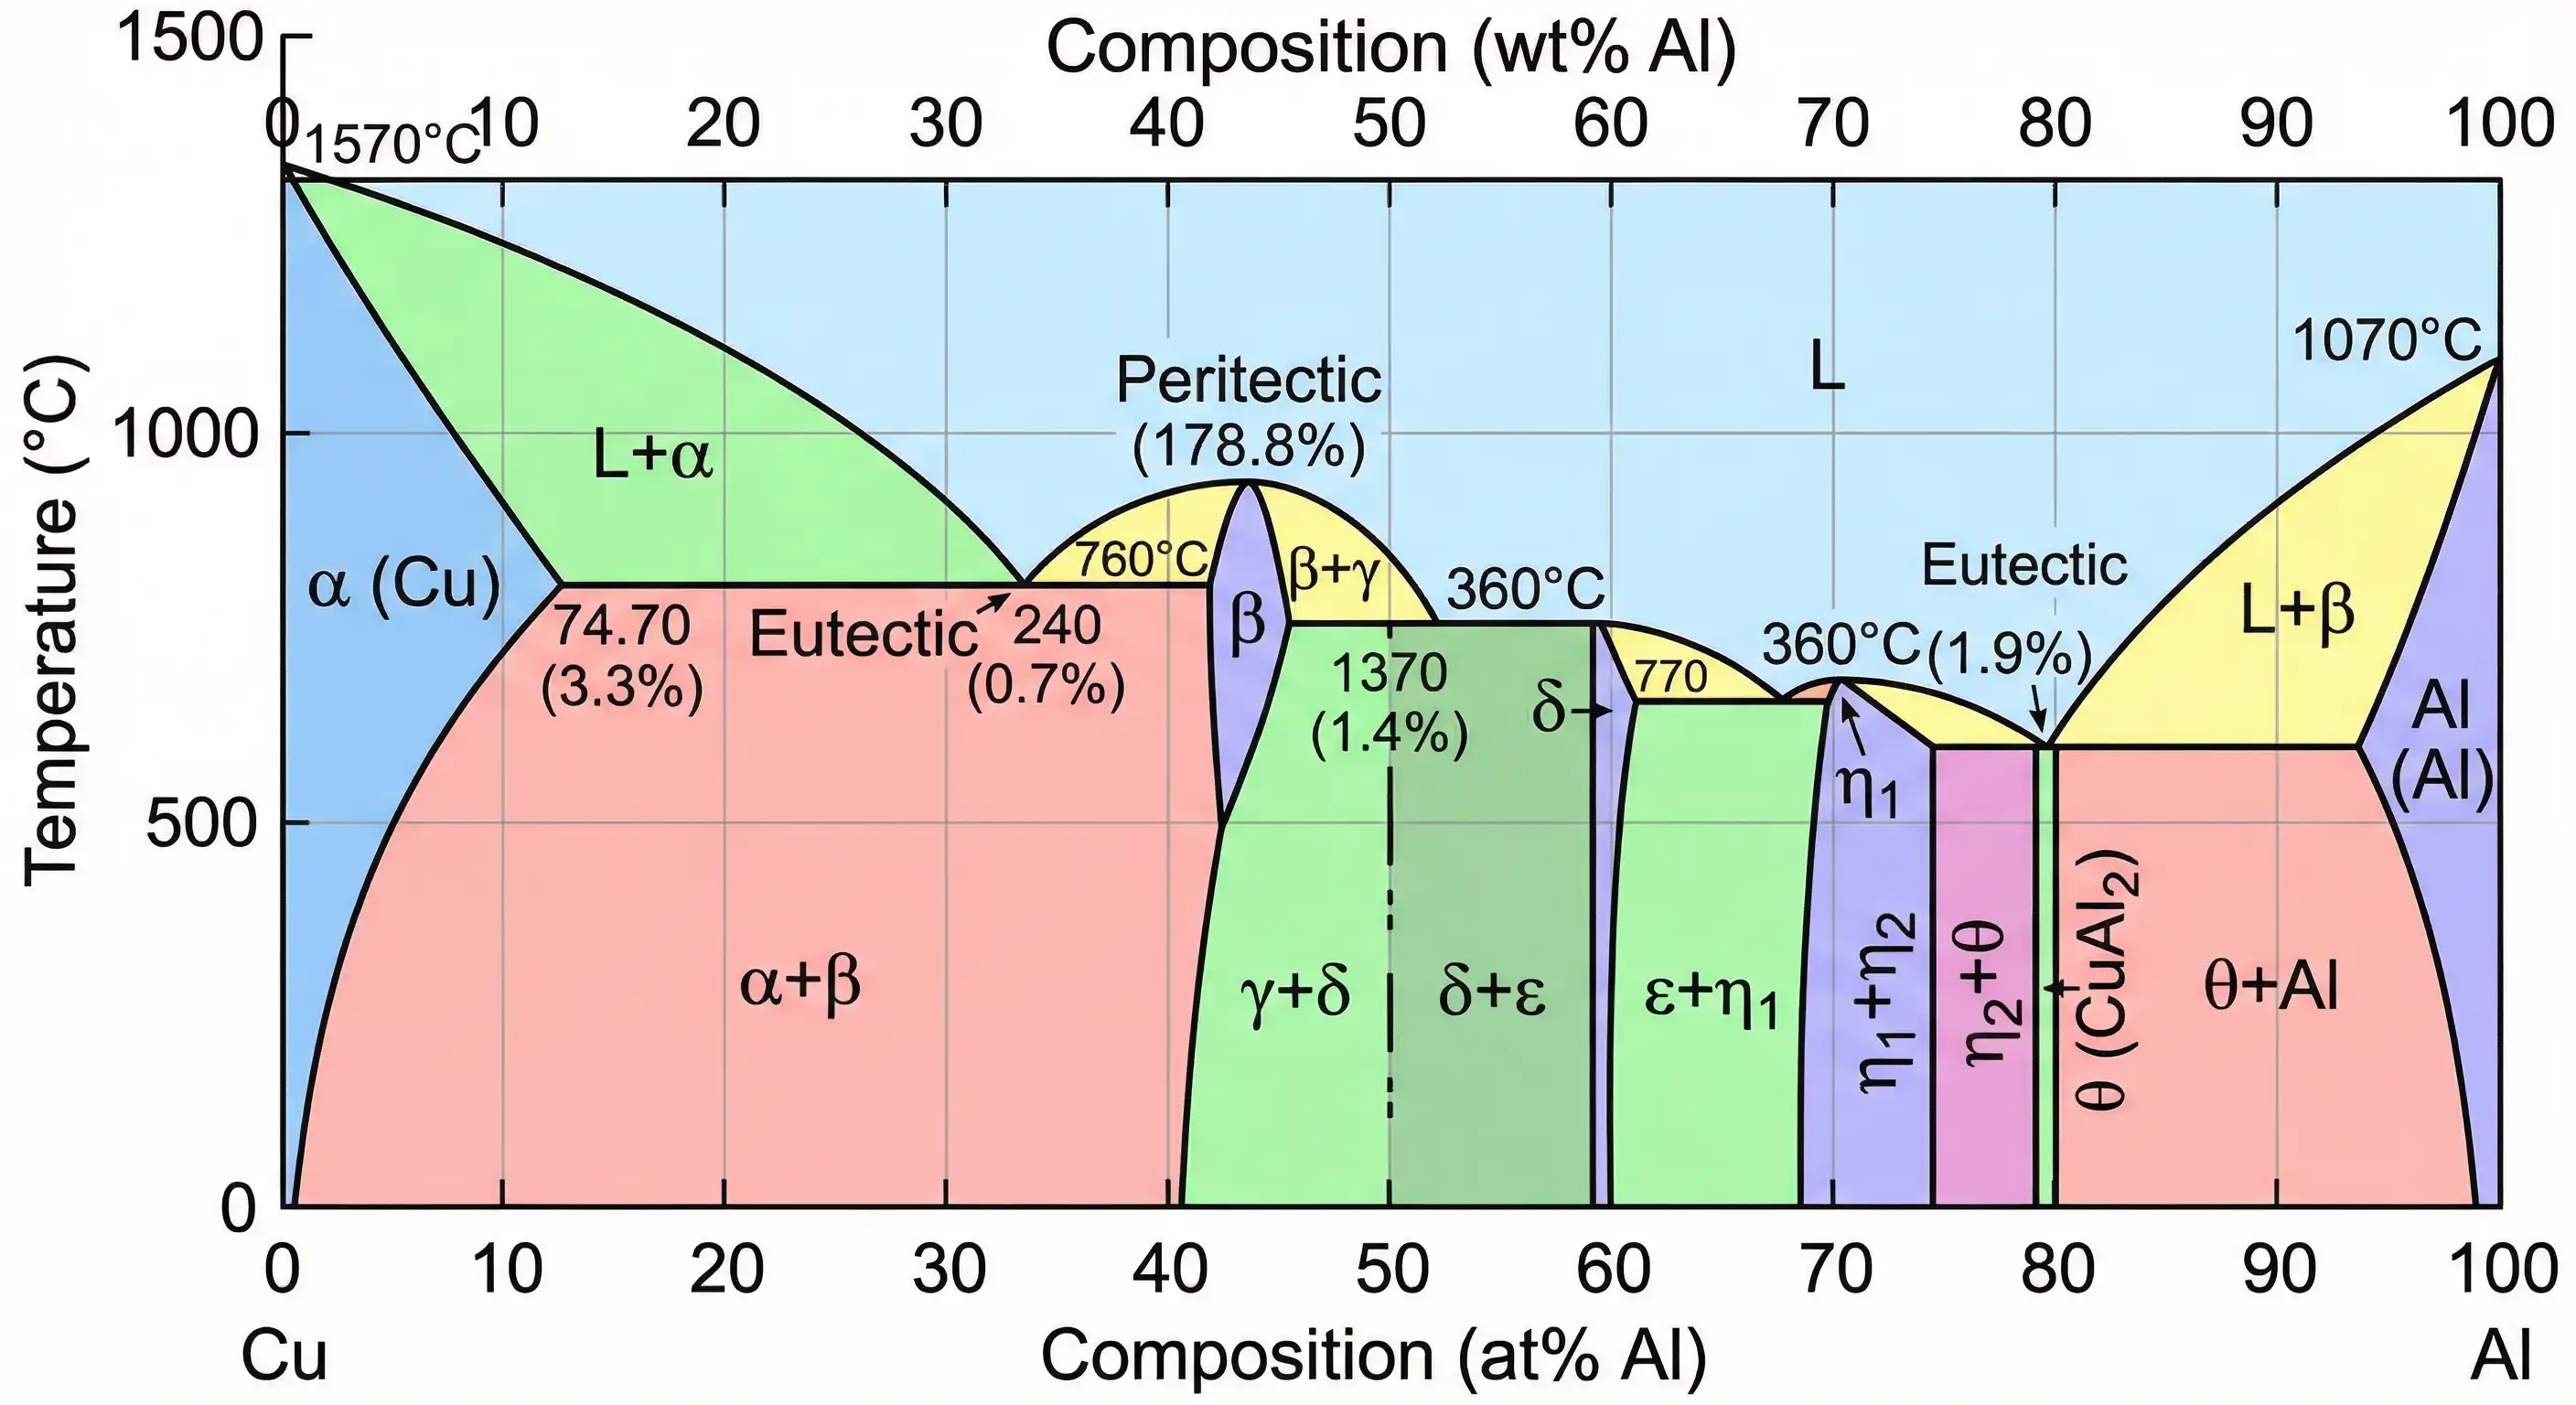
4. Material-Specific Considerations
Phase Diagram Analysis:
The Cu-Al system contains multiple intermetallic phases:
Formation Kinetics:
Intermetallic compound thickness x follows parabolic growth:
Where k = growth constant, t = time.
Optimization Strategies:
- Minimize high-temperature dwell time
- Control interface temperature during drawing
- Target intermetallic compound thickness <3 μm
Diffusion Characteristics:
The Cu-Fe system has limited mutual solubility:

Key Points:
- Maximum solubility of Cu in Fe: ~8% (at 850°C)
- Maximum solubility of Fe in Cu: ~4% (at 1100°C)
- No significant intermetallic compound formation below 600°C
Bonding Mechanism: Primarily mechanical interlocking with minimal diffusion contribution; strong bonds achievable through cold welding
Complete Solid Solution:
Ni and Cu form a continuous solid solution:
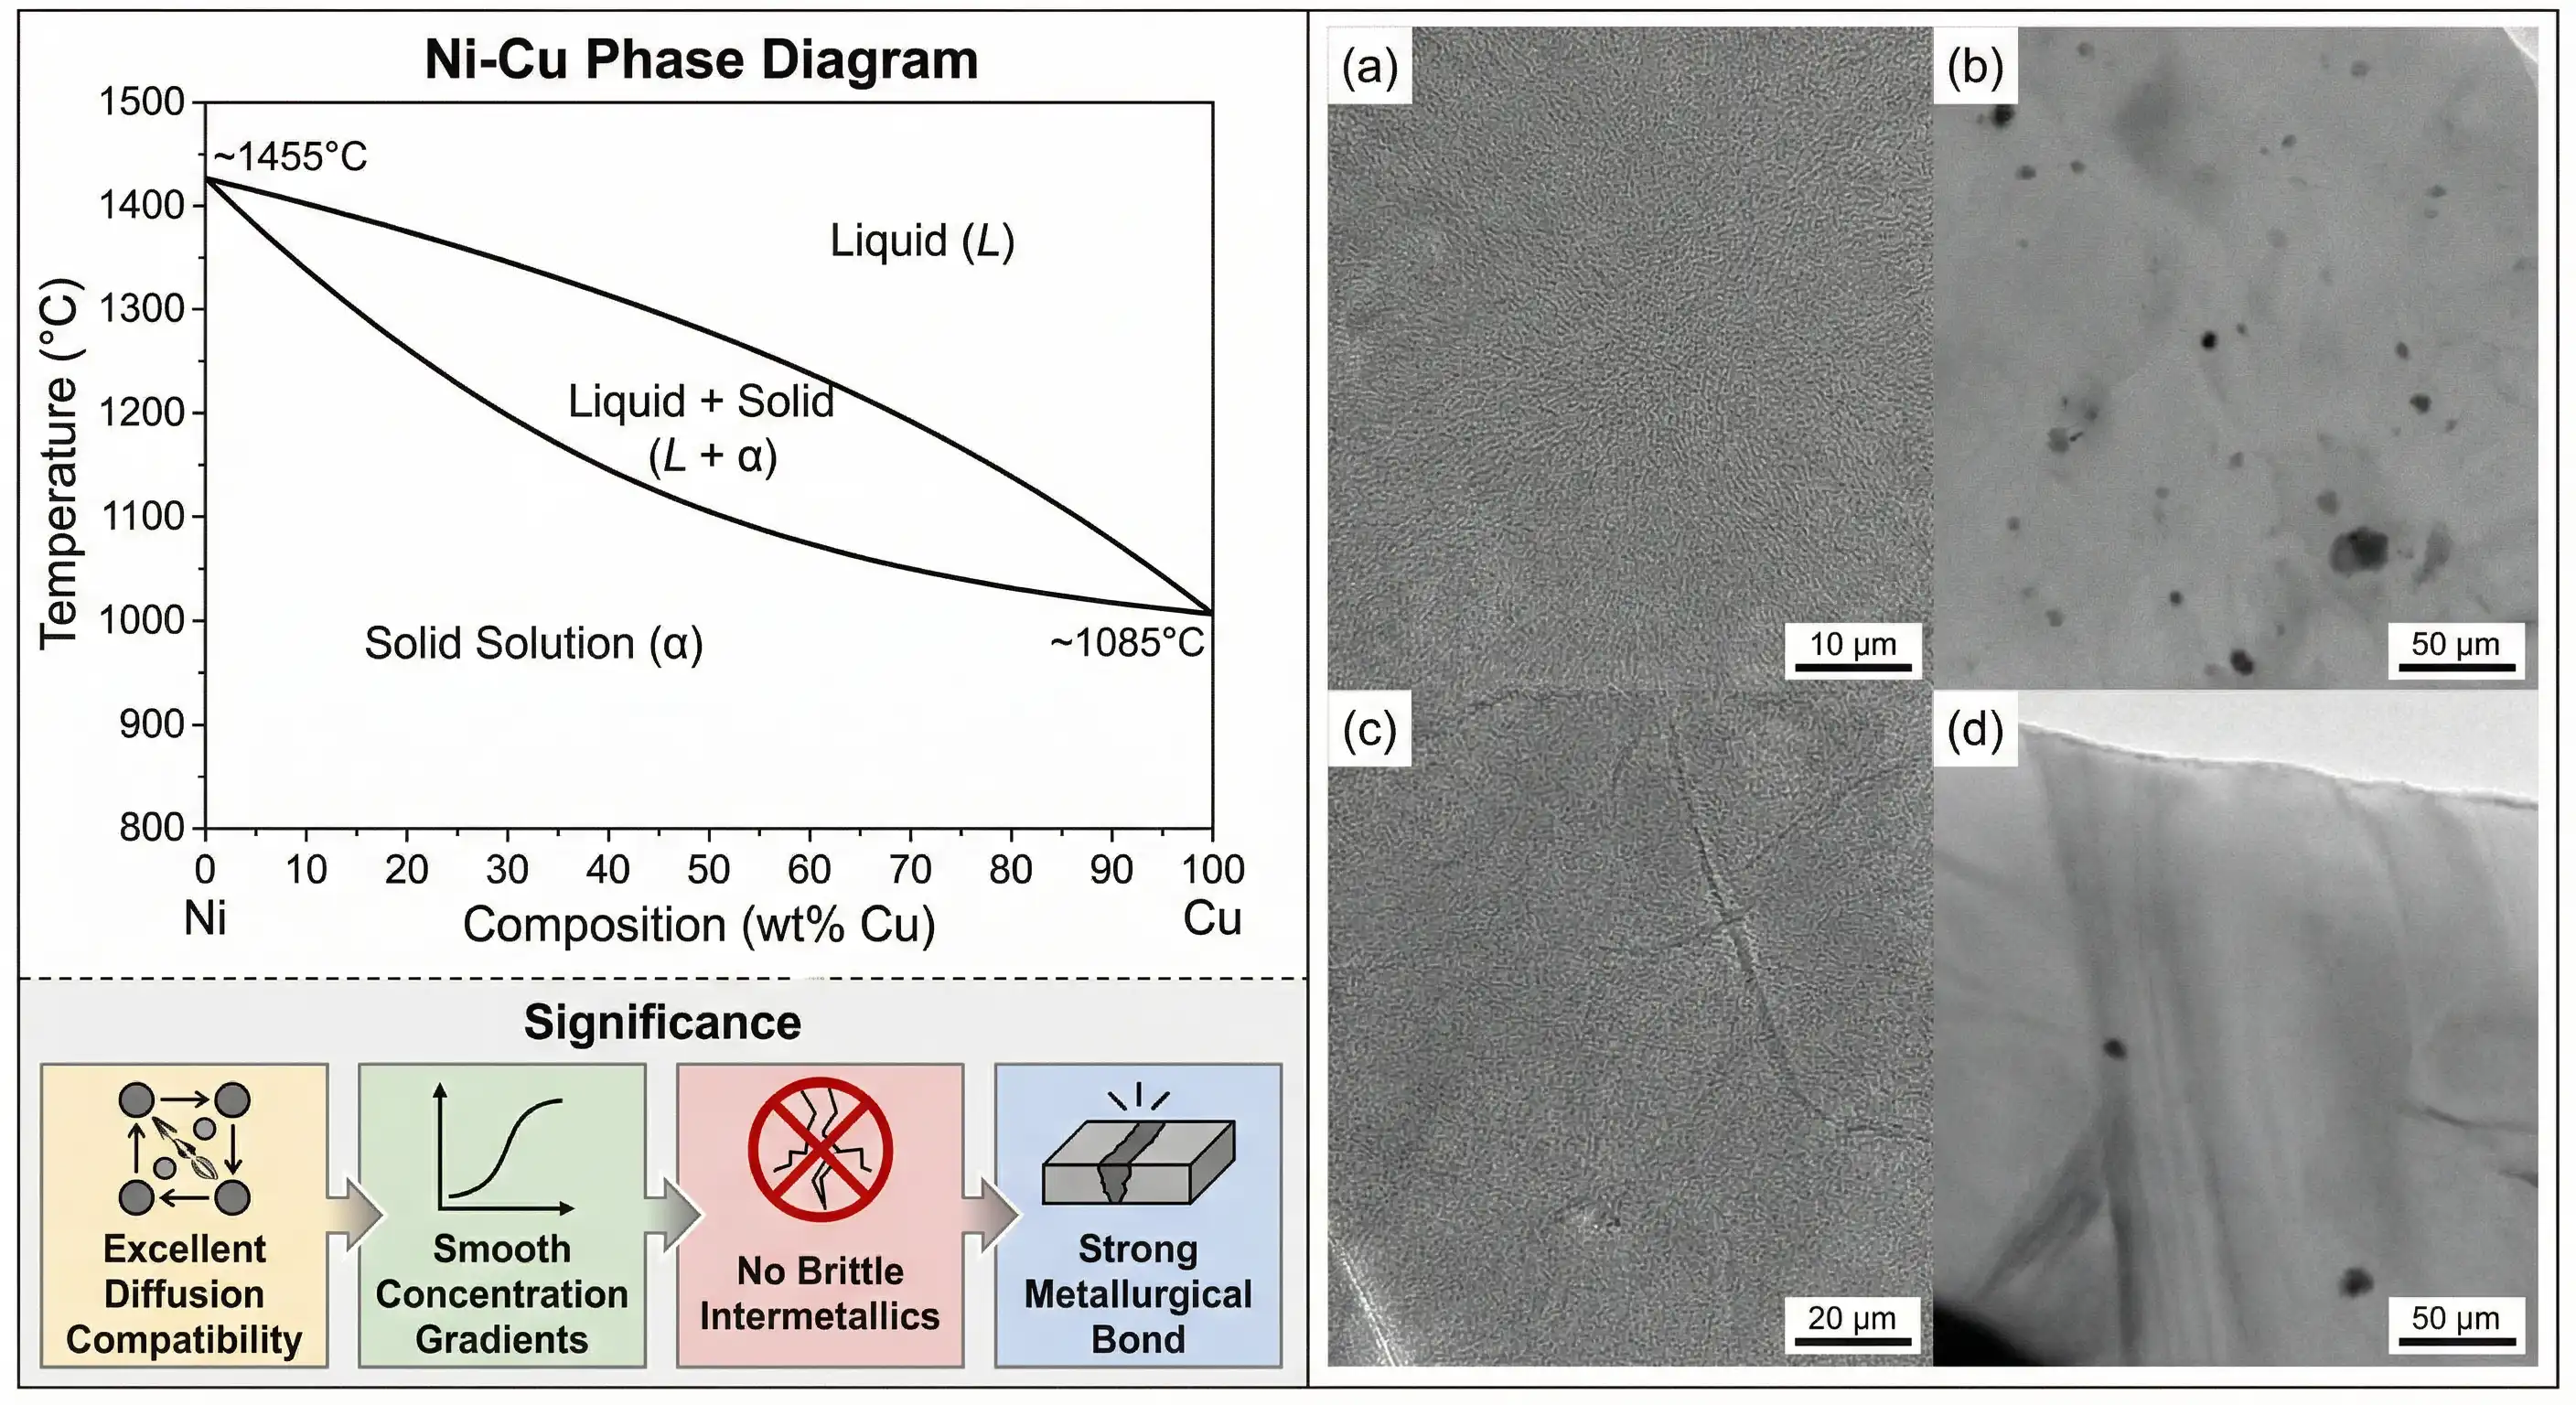
Significance:
- Excellent diffusion compatibility
- Gradual concentration gradient
- No brittle intermetallic compounds
- Strong metallurgical bonding achievable
Eutectic System:
The Ag-Cu system has a eutectic point at 780°C:
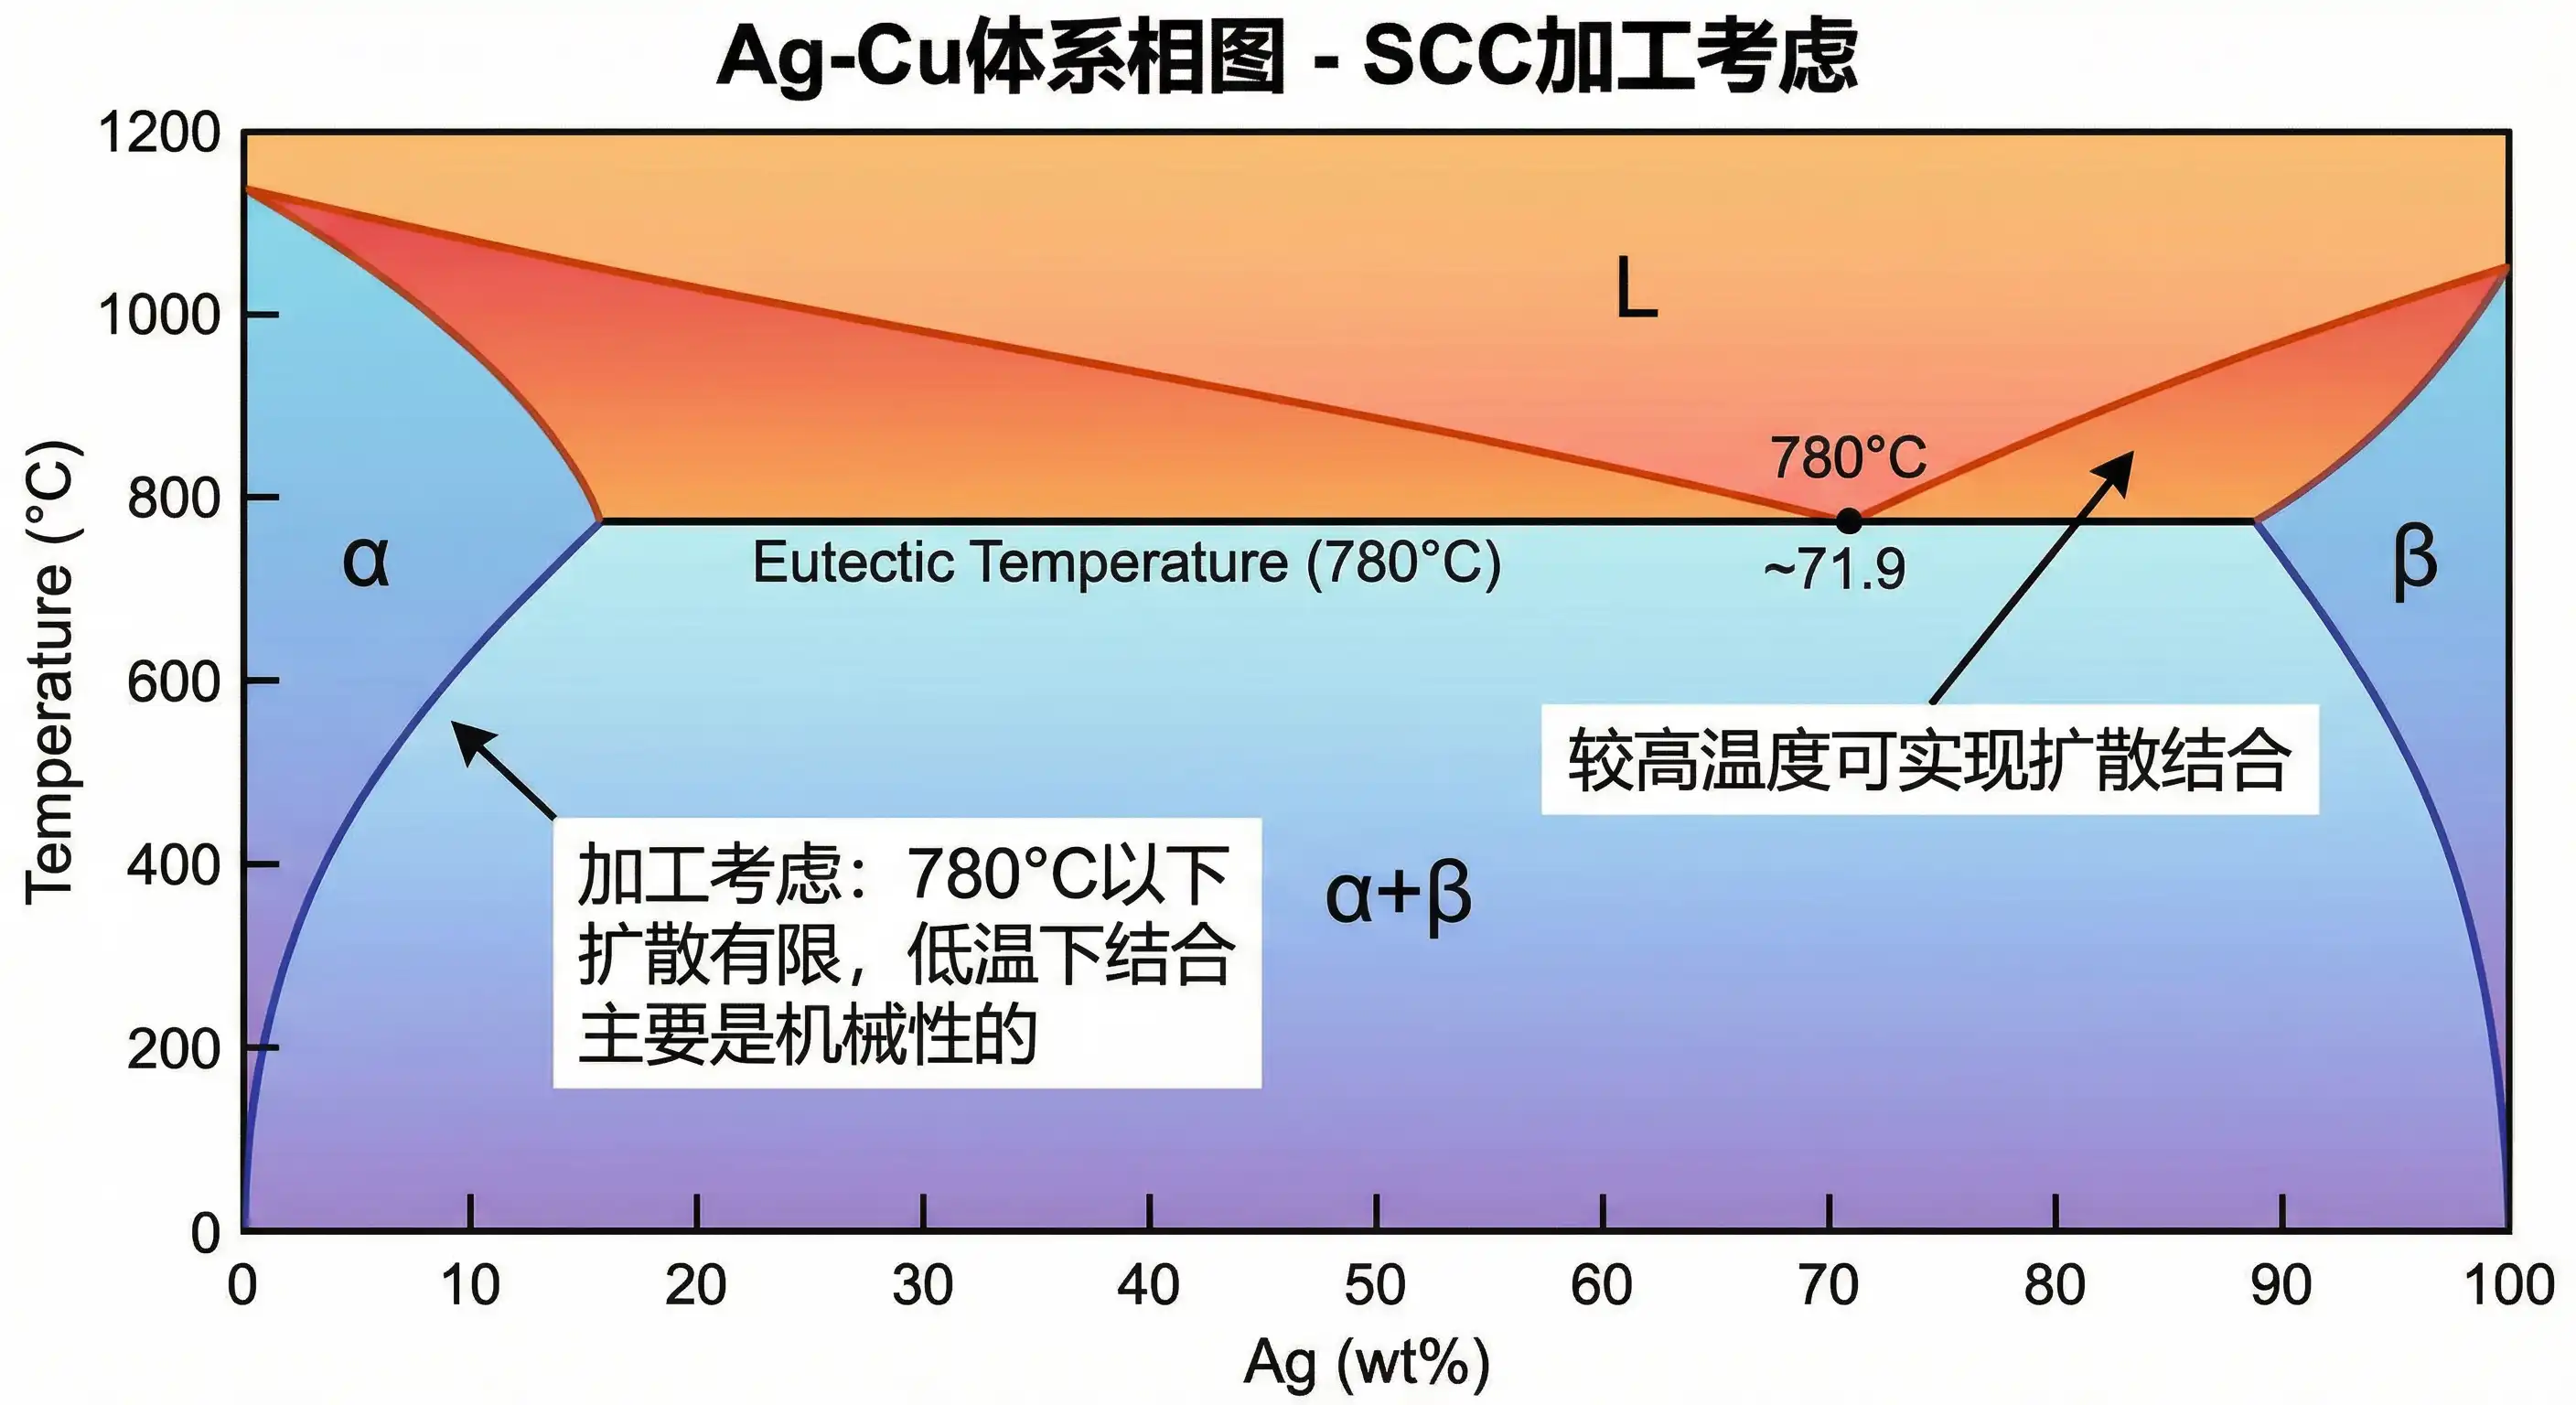
Processing Considerations:
- Below 780°C: Limited diffusion
- Low-temperature bonding is primarily mechanical
- Higher temperatures enable diffusion bonding
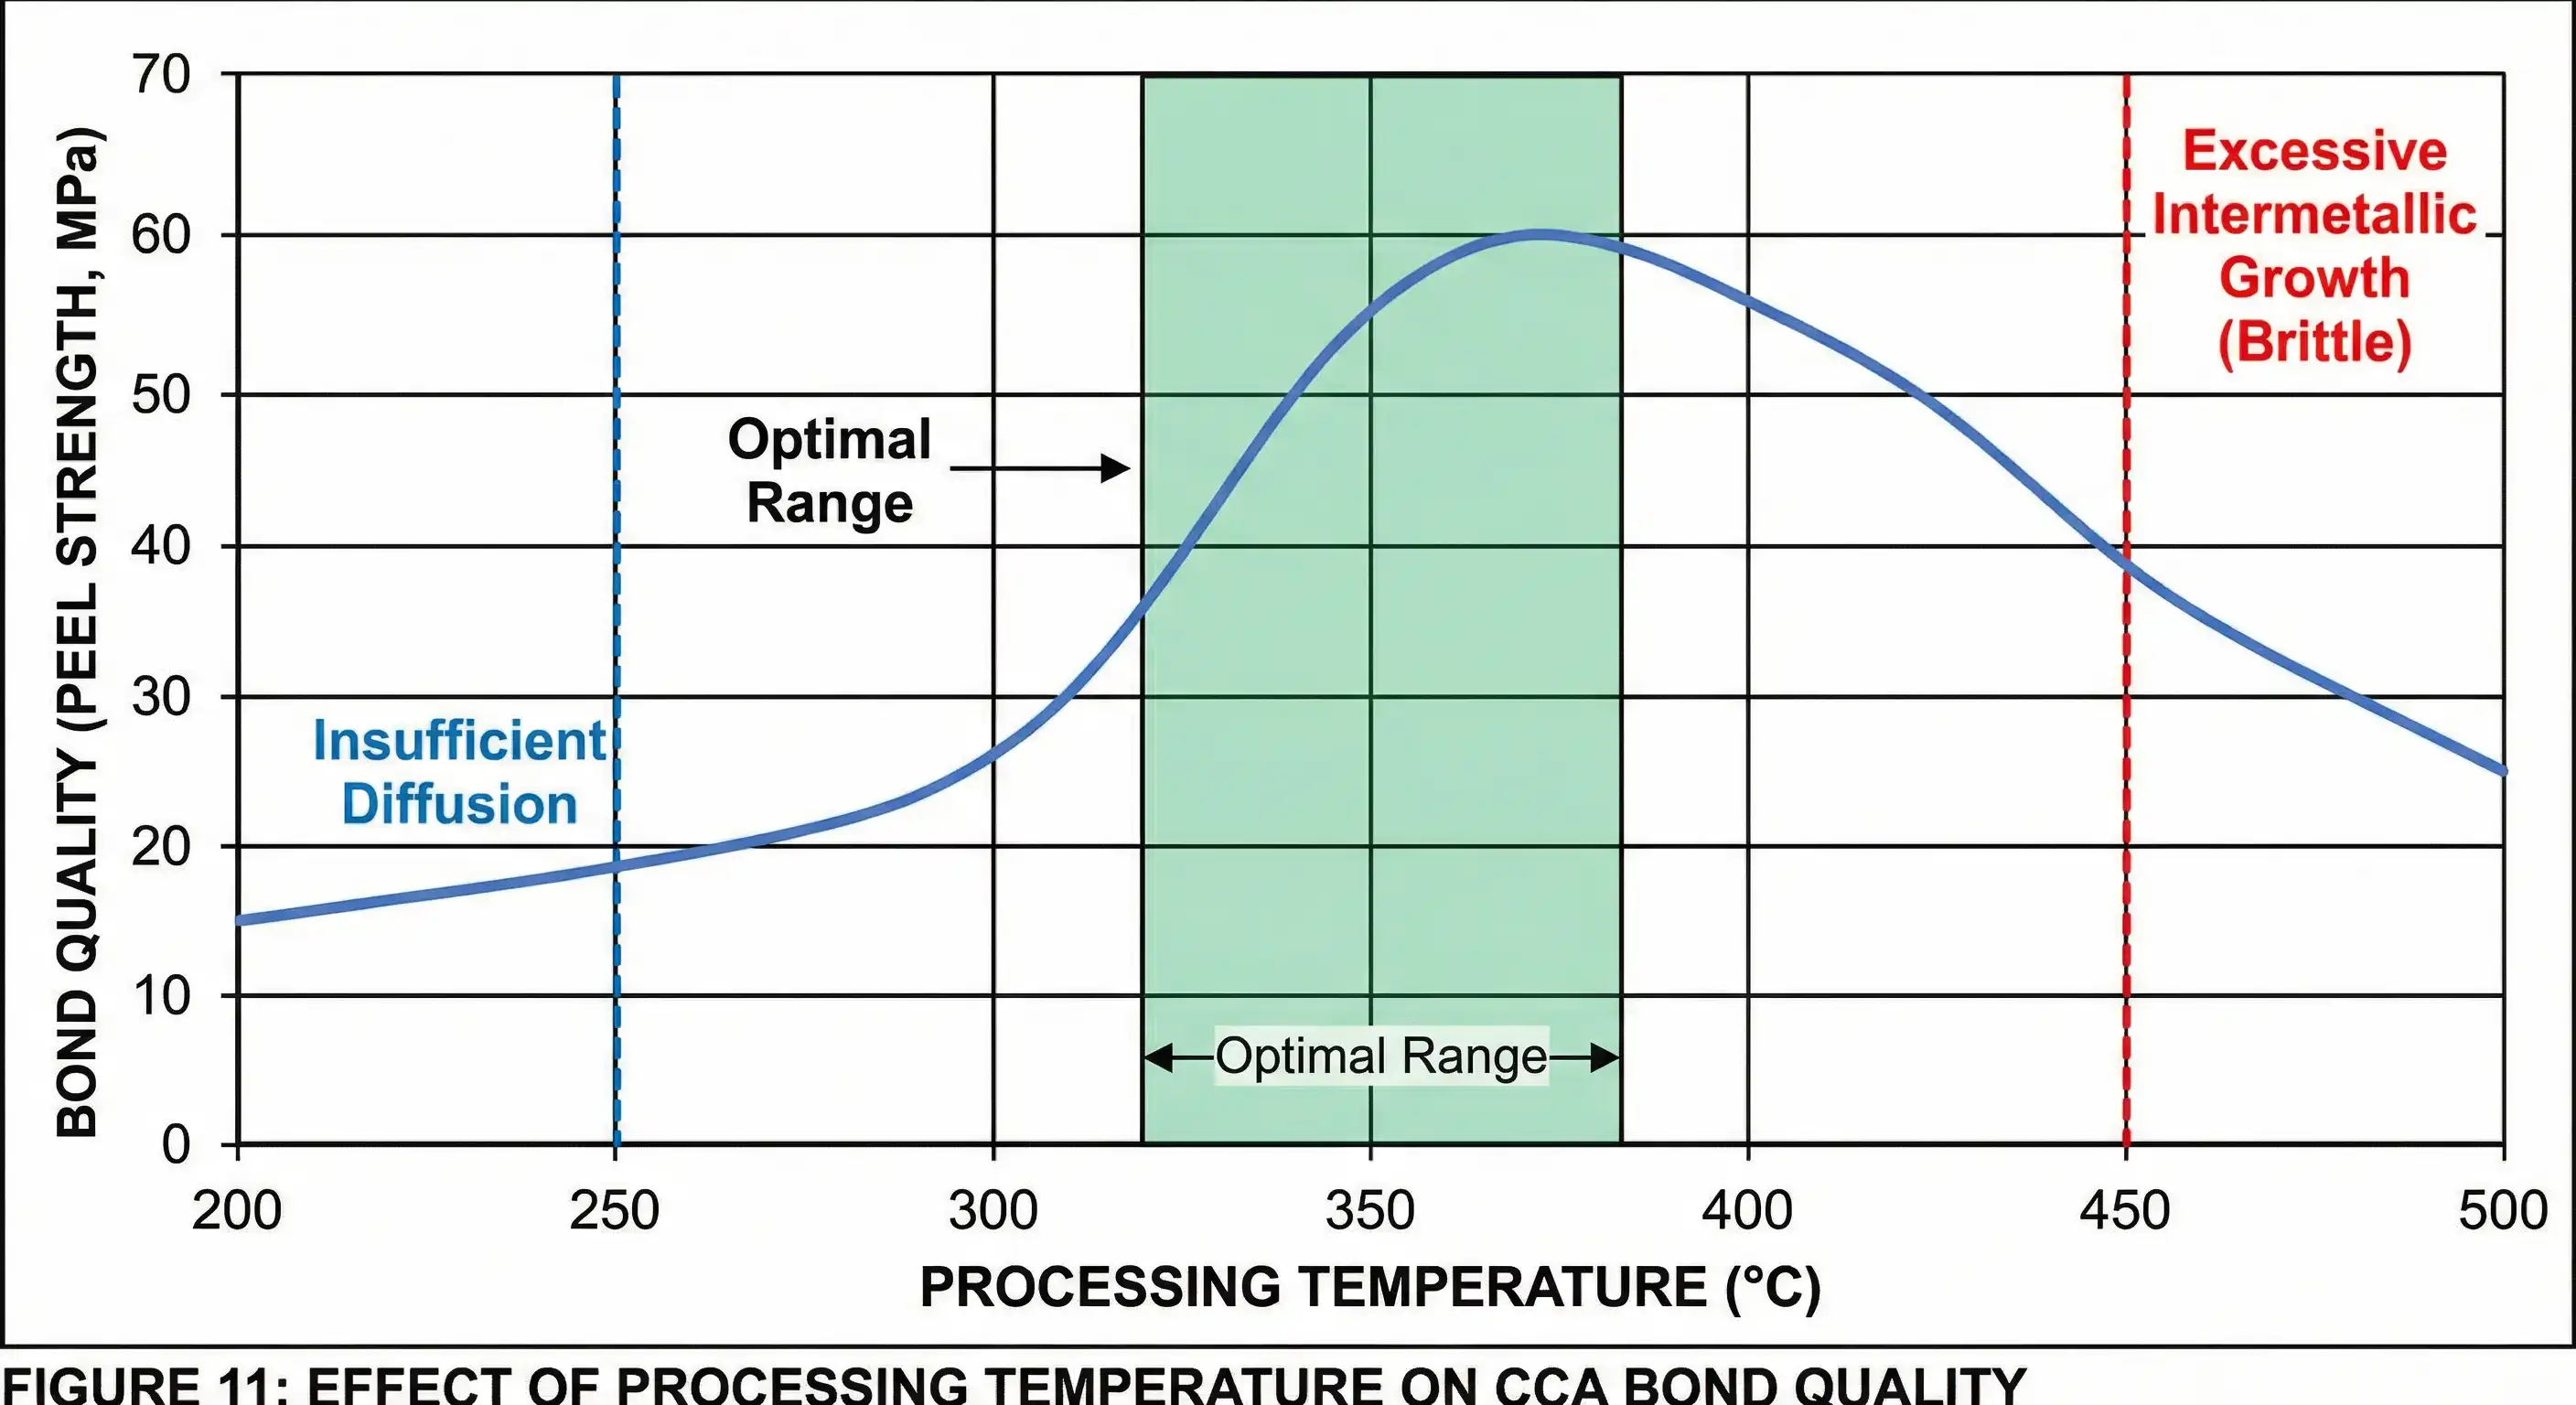
5. Process Parameters
Temperature Window:
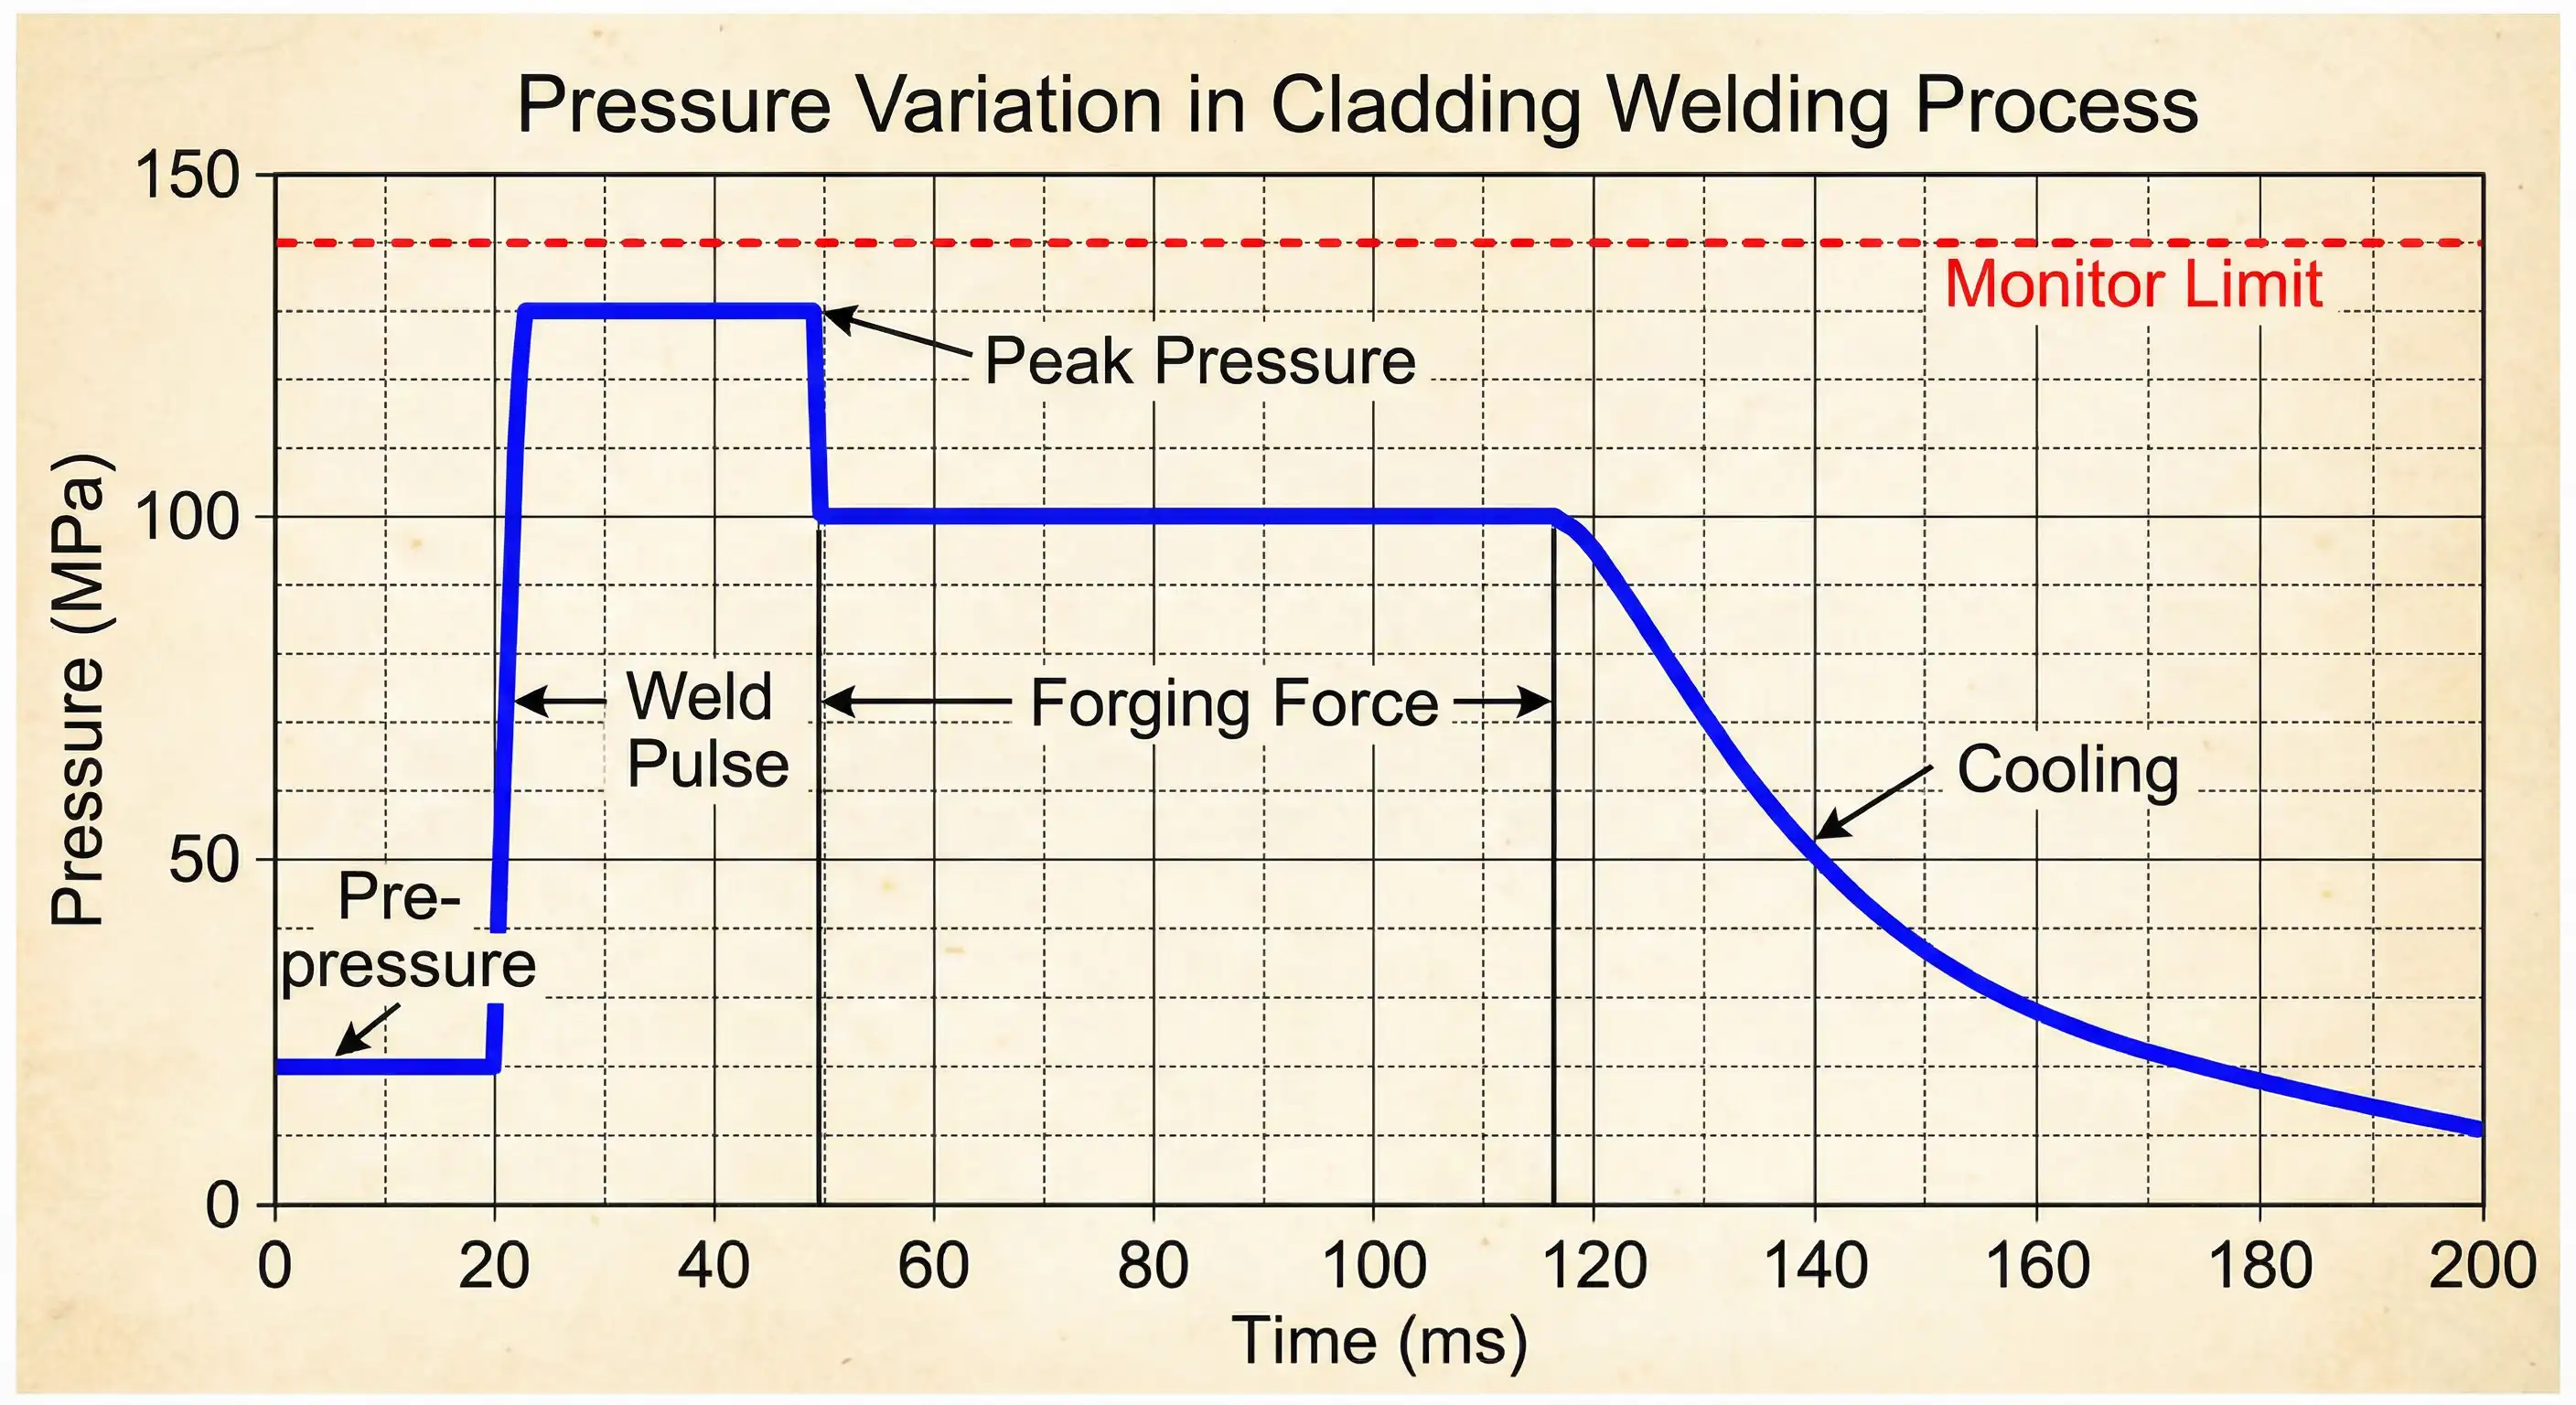
Clad Welding Process:
Diffusion Time:
High-temperature dwell time affects intermetallic compound growth:
Practical Guidelines:
- Minimize Cu-Al time above 300°C
- Allow sufficient stress relief time during annealing
- Balance diffusion requirements with IMC growth
6. Quality Assessment
Ultrasonic Testing:
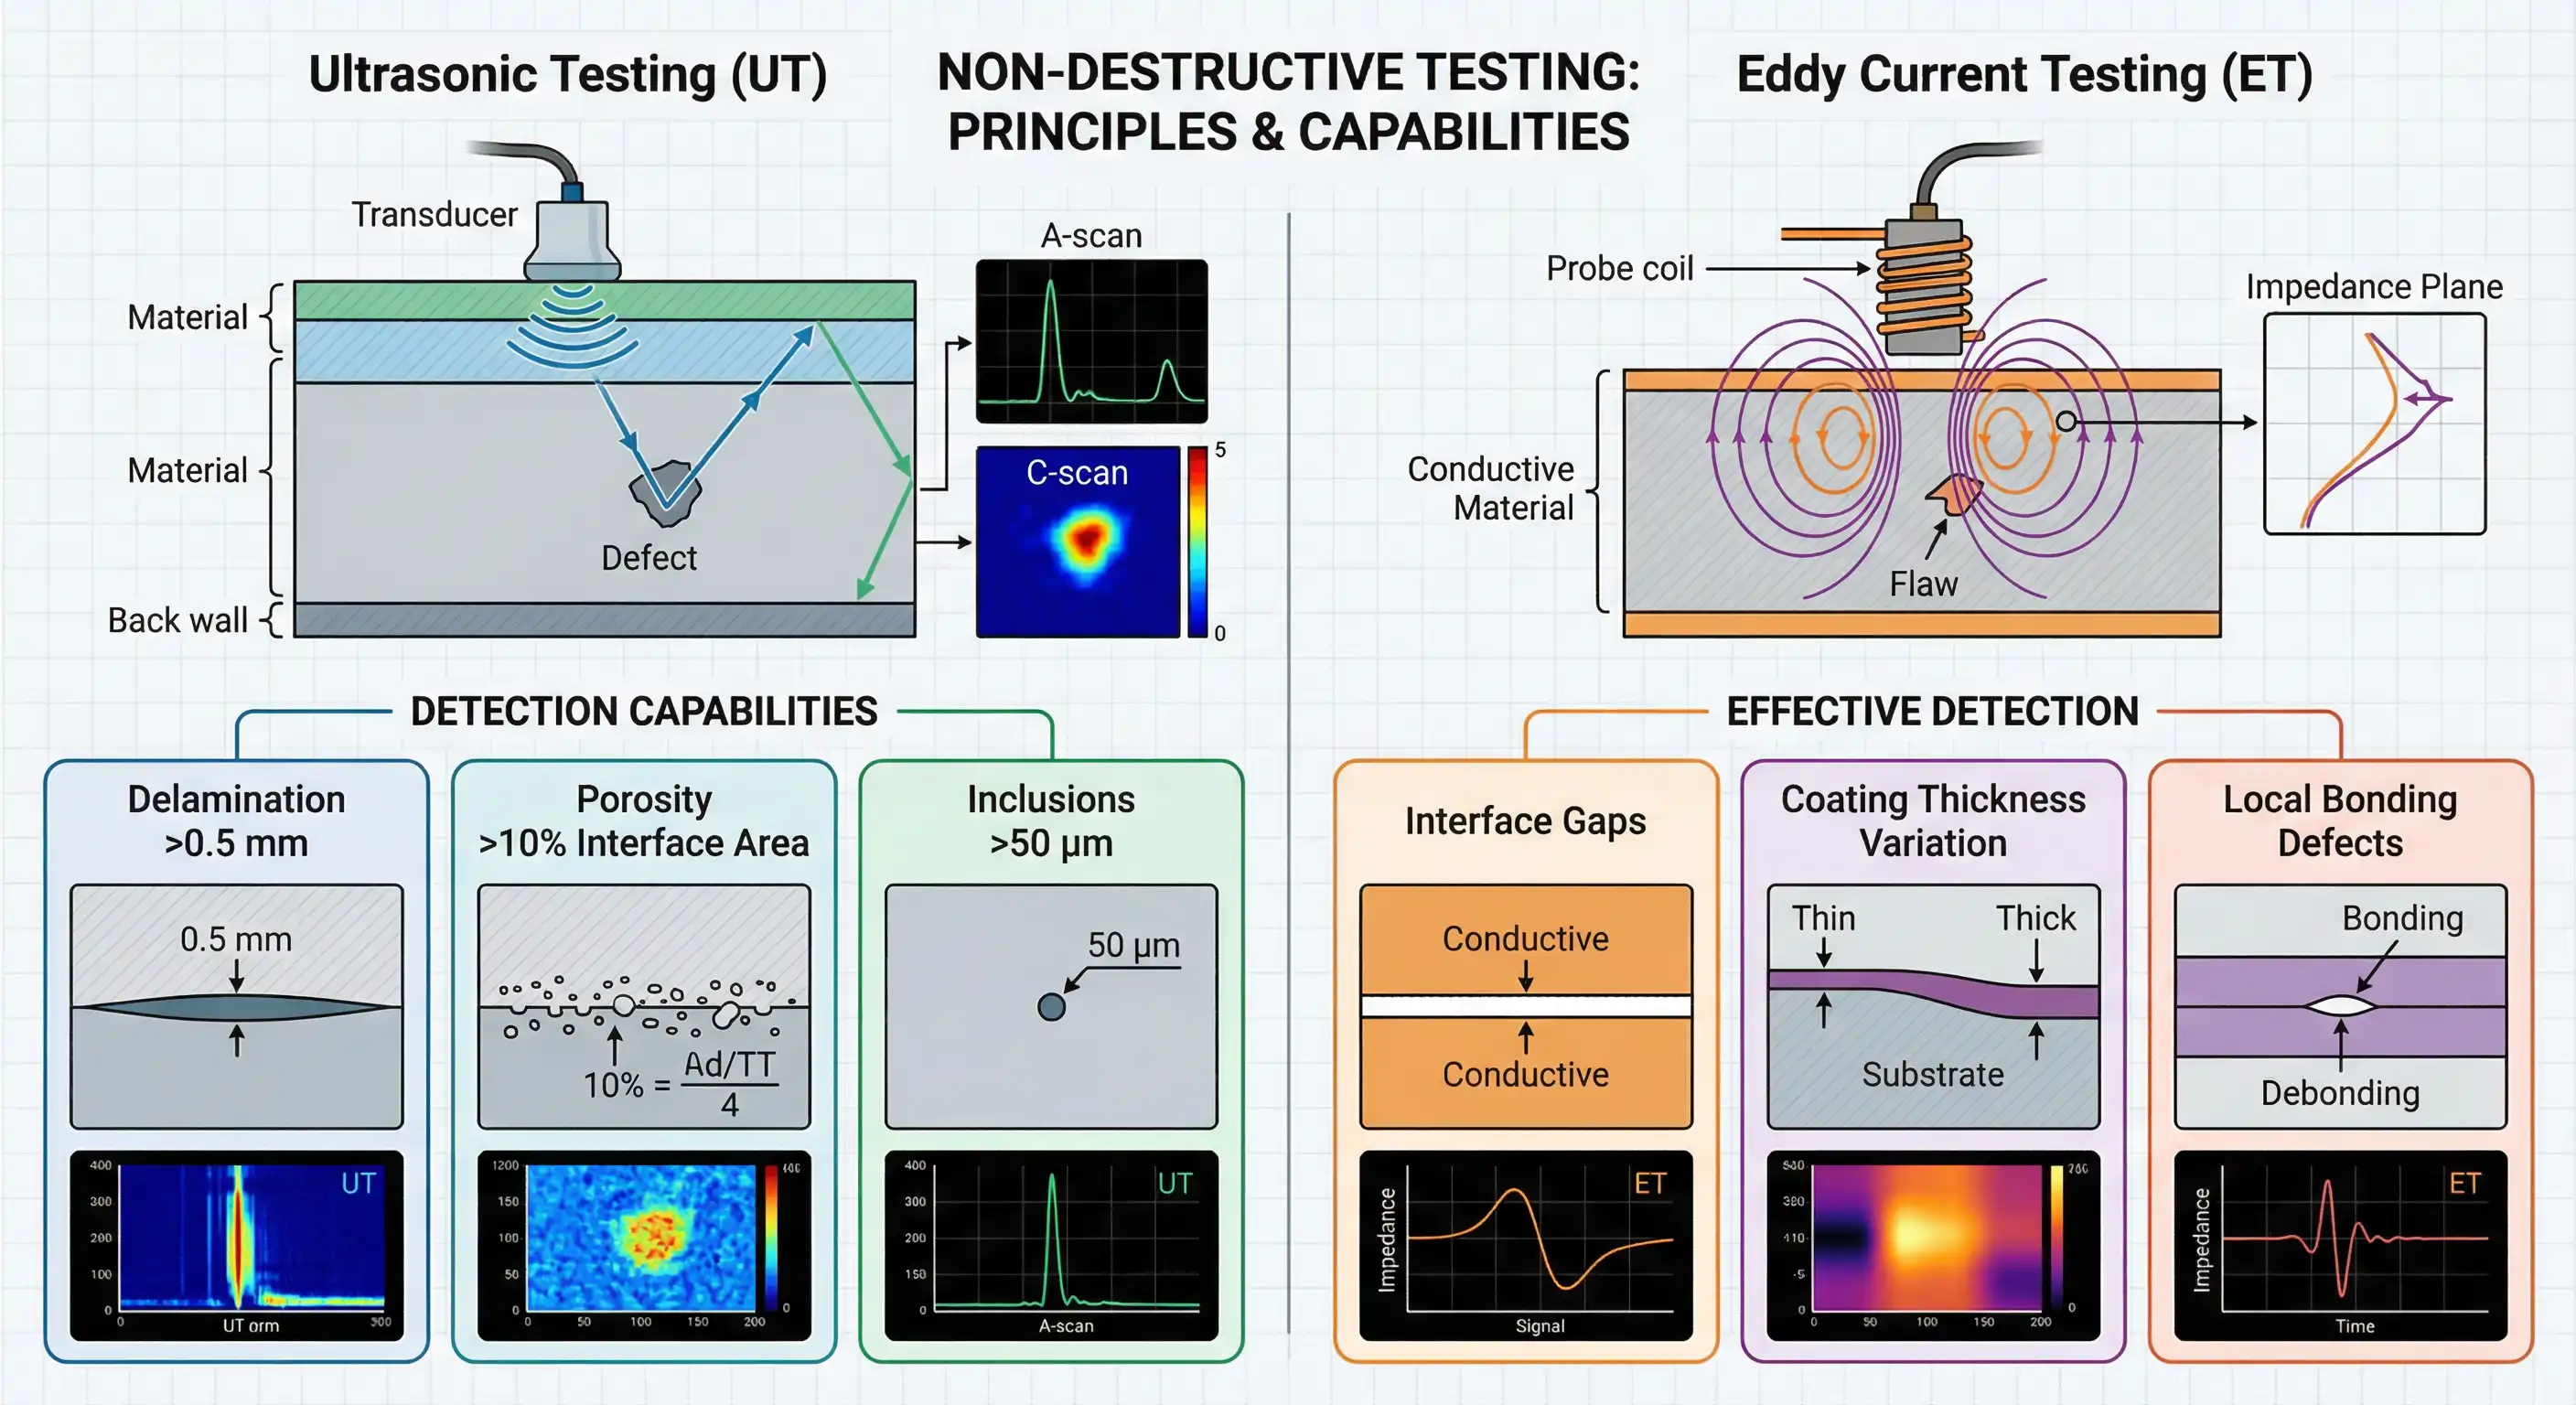
Detection Capabilities:
- Delamination >0.5 mm
- Porosity >10% interface area
- Inclusions >50 μm
Eddy Current Testing:
Effective detection: interface gaps, cladding thickness variation, localized bonding defects
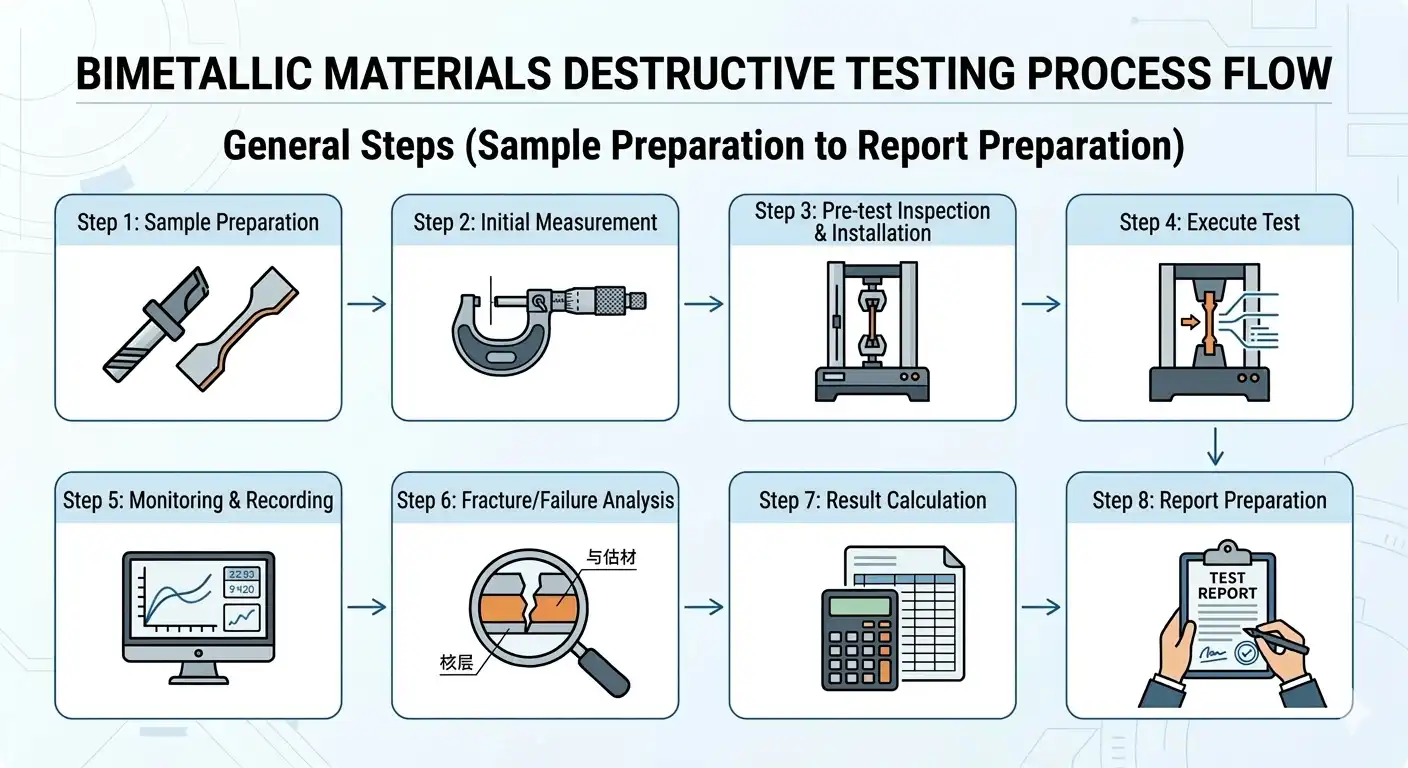
Standard Test Sequence:
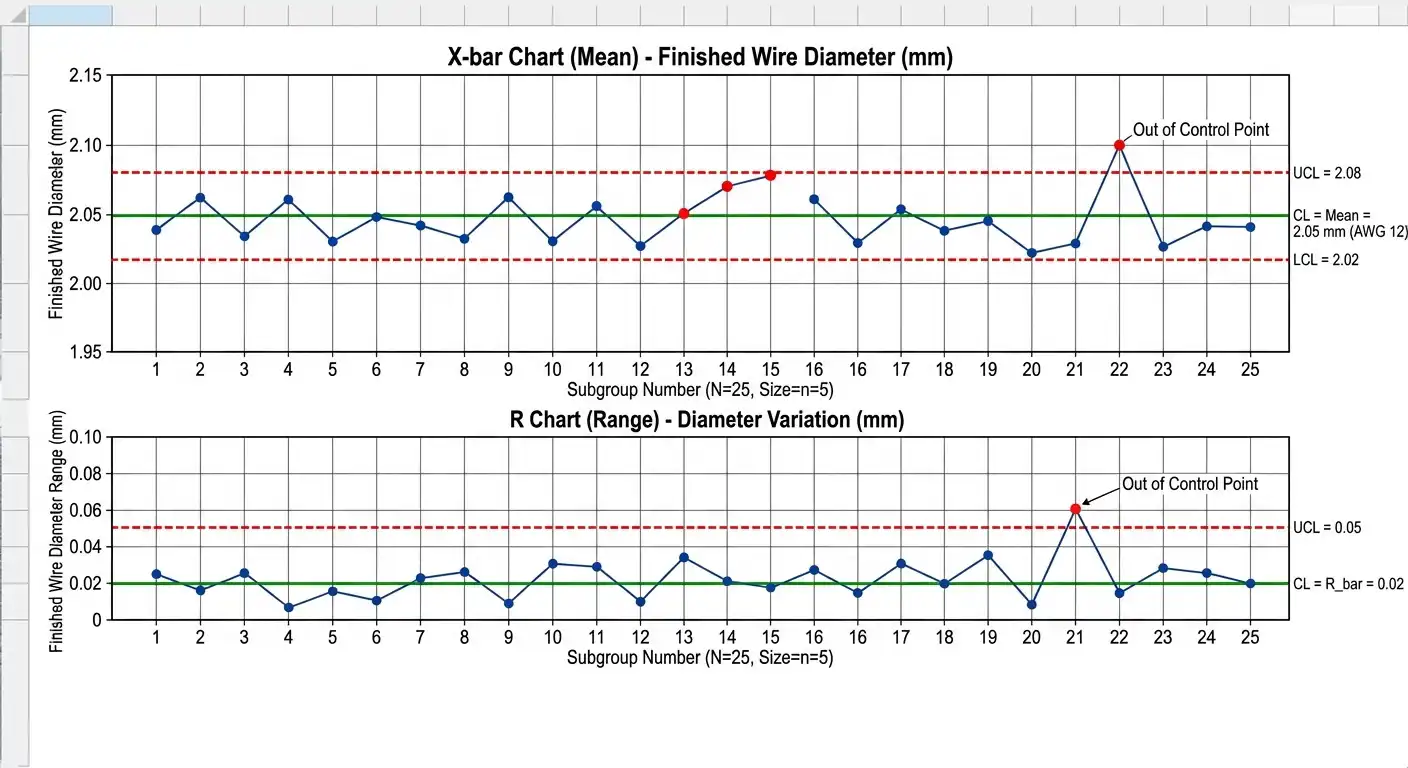
Key Metrics:
7. Failure Modes
Case Study 1: CCA Thermal Cycling Failure
- Application: Automotive engine compartment wiring harness
- Failure: Interface delamination after 500 thermal cycles
- Root Cause: Intermetallic compound layer >5 μm causing brittleness
- Solution: Reduce processing temperature, shorten annealing time
Case Study 2: CCS Grounding Conductor Failure
- Application: Substation grounding
- Failure: Interface corrosion after 10 years
- Root Cause: Cladding damage during installation exposed steel core
- Solution: Improve installation procedures, add protective coating
8. Optimization Strategies
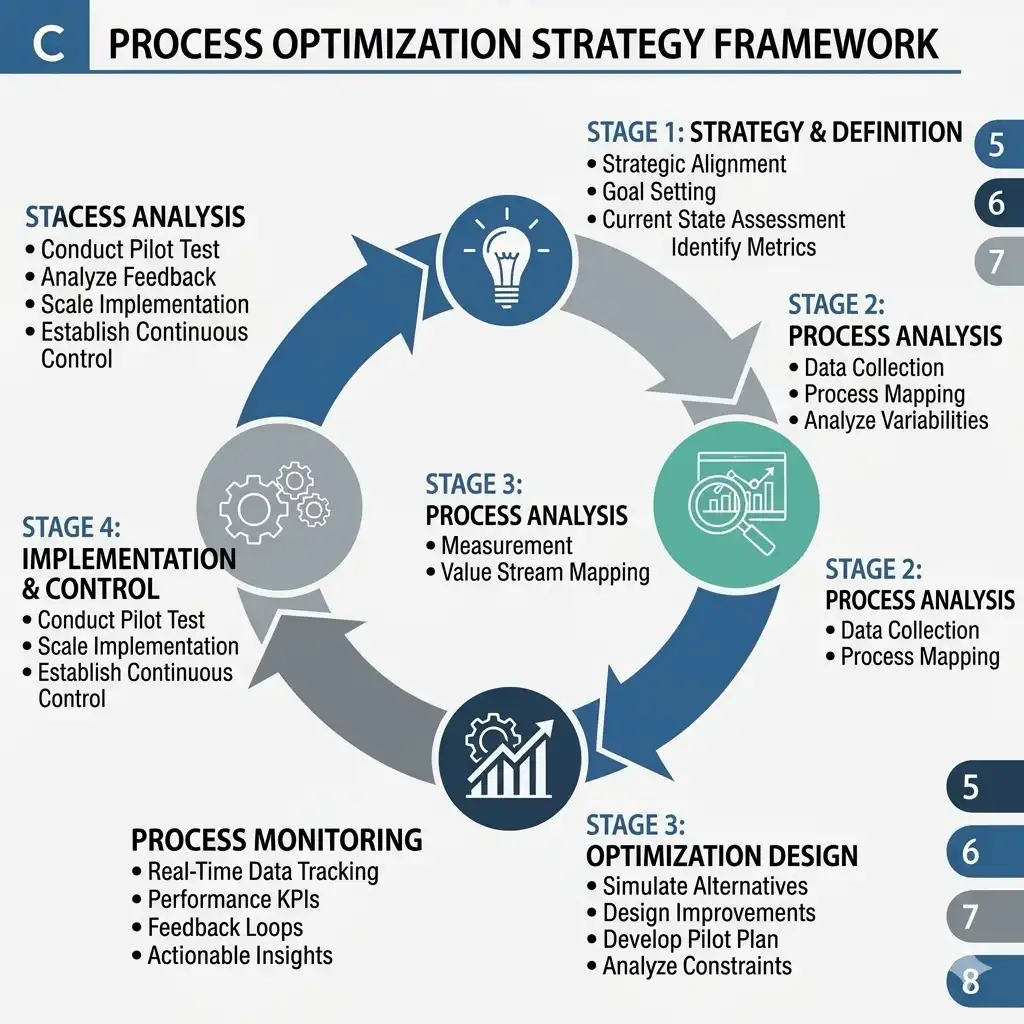
Design of Experiments (DOE) Approach:
Emerging Technologies:
- Ultrasonic-assisted cladding: Enhanced bonding at low temperatures
- Electromagnetic pulse bonding: Rapid solid-state bonding
- Laser surface treatment: Controlled oxide removal
- Nanostructured interfaces: Engineered interface properties
9. Conclusions
- Bond quality is critical,determining bimetallic conductor performance
- Three mechanisms contribute to bond formation: diffusion, interlocking, and metallic bonding
- Temperature control is critical for managing intermetallic compound formation
- Characterization methods enable quality verification and optimization
- Material-specific considerations require tailored processing parameters
For Production: Control temperature window, optimize pressure profile, monitor atmosphere
For Quality: Implement SPC, standardize testing, track failure modes
For R&D: Study new material combinations, develop advanced characterization, model interface behavior
Contact Raytron Now - Let Every Meter of Material Create Higher Value for You
Our technical team is the author of multiple Chinese national standards, with 30 years of industry experience and 34 patents, delivering professional bimetallic composite material solutions. Contact us for technical support and product quotes.
Frequently Asked Questions
What is metallurgical bonding? How does it differ from mechanical bonding?
Metallurgical bonding is a permanent bond formed through atomic diffusion, with bond strength exceeding 150MPa and inseparable interface. Mechanical bonding relies only on surface roughness interlocking, typically <50MPa strength, and may delaminate under thermal cycling or mechanical stress. Clad welding process produces metallurgical bonding.
Why does CCA need to control intermetallic compound thickness?
Intermetallic compounds (e.g., CuAl₂) have high hardness but high brittleness. Excessively thick IMC layer (>5μm) causes interface embrittlement and easy cracking under thermal cycling or mechanical stress. Controlling IMC thickness to <3μm ensures good ductility and fatigue performance.
How to judge bond quality of clad metals?
Key indicators include: peel strength (>45MPa for CCA, >50MPa for CCS), interface resistance (<0.5μΩ·cm²), IMC thickness (<3μm), and bond coverage (>95%). Assessment methods include peel testing, ultrasonic inspection, and metallographic analysis.
How do bonding difficulties differ among material combinations?
Ni-Cu is easiest to bond (complete solid solution, no IMC); Cu-steel has moderate difficulty (limited mutual solubility, mainly mechanical bonding); Cu-Al is most challenging (forms multiple IMCs, requires strict temperature control); Ag-Cu needs to avoid eutectic temperature (780°C).
Figures
Tables
| Bond Quality | Conductivity Efficiency | Tensile Strength | Fatigue Life |
|---|---|---|---|
| Excellent (>50 MPa) | 95-100% | Optimal | Maximum |
| Good (30-50 MPa) | 90-95% | Near optimal | Good |
| Fair (20-30 MPa) | 80-90% | Reduced | Moderate |
| Poor (<20 MPa) | <80% | Compromised | Limited |
| System | D₀ (m²/s) | Q (kJ/mol) | Temp at D=10⁻¹⁴ m²/s |
|---|---|---|---|
| Cu → Al | 6.5 × 10⁻⁵ | 136 | 345°C |
| Al → Cu | 1.7 × 10⁻⁴ | 157 | 385°C |
| Ni → Cu | 2.7 × 10⁻⁵ | 236 | 520°C |
| Cu → Ni | 2.3 × 10⁻⁴ | 228 | 485°C |
| Cu → Fe | 3.0 × 10⁻⁴ | 240 | 530°C |
| Technique | Resolution | Information Obtained | Typical Application |
|---|---|---|---|
| Optical Microscopy | 0.5 μm | Layer thickness, defects | Routine inspection |
| SEM | 10 nm | Interface morphology | Quality control |
| TEM | 0.1 nm | Atomic structure | Research |
| AFM | 0.01 nm | Surface topography | Research |
| Material Pair | Processing Temp | Time | Diffusion Zone Width |
|---|---|---|---|
| Cu/Al | 350°C | 1 hour | 2-5 μm |
| Cu/Al | 400°C | 1 hour | 5-10 μm |
| Ni/Cu | 400°C | 1 hour | <1 μm |
| Cu/Steel | 500°C | 1 hour | <0.5 μm |
| Material | Peel Strength (MPa) | Failure Mode |
|---|---|---|
| CCA (Well bonded) | 45-65 | Al cohesive failure |
| CCA (Poorly bonded) | 15-30 | Interface failure |
| CCS | 50-70 | Steel cohesive failure |
| NCC | 40-55 | Interface or cohesive |
| Phase | Composition | Crystal Structure | Hardness (HV) | Brittleness |
|---|---|---|---|---|
| θ | CuAl₂ | Tetragonal | 350-400 | High |
| η₂ | CuAl | Orthorhombic | 400-450 | Very high |
| γ₂ | Cu₉Al₄ | Cubic | 300-350 | Medium |
| γ₁ | Cu₈Al₃ | Cubic | 250-300 | Medium |
| Temperature | k (μm²/h) | Time to form 5 μm IMC |
|---|---|---|
| 300°C | 0.5 | 50 hours |
| 350°C | 2.0 | 12.5 hours |
| 400°C | 8.0 | 3 hours |
| 450°C | 30.0 | 1 hour |
| Temperature | Time | Bond Strength | Failure Mode |
|---|---|---|---|
| 350°C | 1h | 35-45 MPa | Interface |
| 400°C | 1h | 45-55 MPa | Mixed |
| 450°C | 1h | 55-65 MPa | Cohesive |
| Material | Min Bonding Temp | Optimal Range | Avoid Exceeding |
|---|---|---|---|
| Cu/Al (CCA) | 250°C | 320-380°C | 450°C (Excess IMC) |
| Cu/Steel (CCS) | 200°C | 300-400°C | 600°C |
| Ni/Cu (NCC) | 300°C | 350-450°C | 600°C |
| Ag/Cu (SCC) | 200°C | 300-400°C | 780°C (Melting) |
| Material | Atmosphere | Purpose |
|---|---|---|
| CCA | Inert (N₂, Ar) | Prevent oxidation |
| CCS | Inert or reducing | Remove surface oxides |
| NCC | Inert | Maintain Ni surface quality |
| SCC | Inert | Prevent Ag tarnishing |
| Failure Mode | Cause | Appearance | Prevention |
|---|---|---|---|
| Delamination | Weak bonding | Layer separation | Optimize bonding parameters |
| Brittle fracture | Excess IMC | Clean fracture | Control time/temperature |
| Corrosion | Galvanic effect | Preferential attack | Correct material selection |
| Fatigue cracking | Cyclic loading | Interface cracks | Reduce stress concentration |
| Priority | Cu/Al | Cu/Steel | Ni/Cu | Ag/Cu |
|---|---|---|---|---|
| Highest bond strength | Medium | High | Very high | Medium |
| Process simplicity | Medium | High | High | Medium |
| Temperature stability | Medium | High | Very high | Medium |
| Cost effectiveness | High | Very high | Medium | Low |
References
- Diffusion in Solid Metals and Alloys Springer-Verlag (2007)
- ASM Alloy Phase Diagram Database ASM International (2016)
- The Friction and Lubrication of Solids Clarendon Press (1950)
- A diffusion model for bonding mechanisms in diffusion welding Welding Journal 41 , 45s-52s (1962)
- Solidification Processing McGraw-Hill (1974)
- Interactions between surfaces: Adhesion and friction Surface Physics of Materials 2 , 475-529 (1975)
- Diffusion Bonding of Materials Mir Publishers (1985)
- Diffusion bonding between commercially pure titanium and copper Materials Characterization 59 , 134-142 (2008)
- Intermetallic compound growth in Cu/Al clad wires Journal of Materials Processing Technology 267 , 1-9 (2019)
- On the formation and growth of intermetallic phases during interdiffusion between low-carbon steel and aluminum alloys Acta Materialia 59 , 1586-1600 (2011)
- Interface evolution in copper-clad aluminum wires during thermal processing Materials Science and Engineering A 771 , 138613 (2020)
- ASTM B566-04: Standard Specification for Copper-Clad Aluminum Wire ASTM International (2020)
- ASTM B452-20: Standard Specification for Copper-Clad Steel Wire ASTM International (2020)
- Interface Characterization of Bimetallic Conductors Internal Report TR-2024-045 (2024)